最近一直挺忙的,都沒時間寫博客了,好在這是基礎篇的最後一篇了,我也可以歇歇了,關於其它的 深入章節我會在以後的時間補上的。
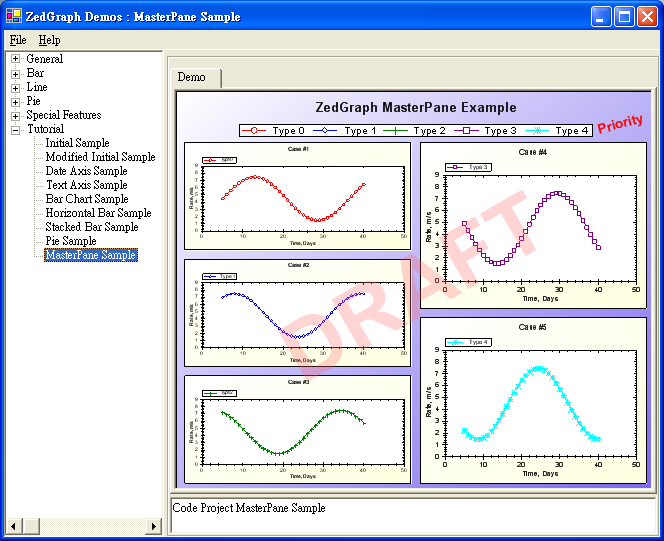
先來看看這一節的示圖和源代碼吧。
using System;


using System.Drawing;


using System.Collections;


using ZedGraph;


namespace ZedGraph.Demo


{


     ///<summary>


     /// Summary description for SimpleDemo.


     ///</summary>


     public class MasterSampleDemo : DemoBase


     {


         public MasterSampleDemo() : base( "Code Project MasterPane Sample",


                  "MasterPane Sample", DemoType.Tutorial )


         {


              MasterPane myMaster = base.MasterPane;


              // Remove the default GraphPane that comes with ZedGraphControl


              myMaster.PaneList.Clear();


              // Set the masterpane title


              myMaster.Title = "ZedGraph MasterPane Example";


              myMaster.IsShowTitle = true;


              // Fill the masterpane background with a color gradient


              myMaster.PaneFill = new Fill( Color.White, Color.MediumSlateBlue, 45.0F );


              // Set the margins to 10 points


              myMaster.MarginAll = 10;


              // Enable the masterpane legend


              myMaster.Legend.IsVisible = true;


              myMaster.Legend.Position = LegendPos.TopCenter;


              // Add a priority stamp


              TextItem text = new TextItem( "Priority", 0.88F, 0.12F );


              text.Location.CoordinateFrame = CoordType.PaneFraction;


              text.FontSpec.Angle = 15.0F;


              text.FontSpec.FontColor = Color.Red;


              text.FontSpec.IsBold = true;


              text.FontSpec.Size = 15;


              text.FontSpec.Border.IsVisible = false;


              text.FontSpec.Border.Color = Color.Red;


              text.FontSpec.Fill.IsVisible = false;


              text.Location.AlignH = AlignH.Left;


              text.Location.AlignV = AlignV.Bottom;


              myMaster.GraphItemList.Add( text );


              // Add a draf watermarkè


              text = new TextItem( "DRAFT", 0.5F, 0.5F );


              text.Location.CoordinateFrame = CoordType.PaneFraction;


              text.FontSpec.Angle = 30.0F;


              text.FontSpec.FontColor = Color.FromArgb( 70, 255, 100, 100 );


              text.FontSpec.IsBold = true;


              text.FontSpec.Size = 100;


              text.FontSpec.Border.IsVisible = false;


              text.FontSpec.Fill.IsVisible = false;


              text.Location.AlignH = AlignH.Center;


              text.Location.AlignV = AlignV.Center;


              text.ZOrder = ZOrder.A_InFront;


              myMaster.GraphItemList.Add( text );


              // Initialize a color and symbol type rotator


              ColorSymbolRotator rotator = new ColorSymbolRotator();


              // Create some new GraphPanes


              for ( int j=0; j<5; j++ )


              {


                  // Create a new graph - rect dimensions do not matter here, since it


                  // will be resized by MasterPane.AutoPaneLayout()


                  GraphPane myPane = new GraphPane( new Rectangle( 10, 10, 10, 10 ),


                       "Case #" + (j+1).ToString(),


                       "Time, Days",


                       "Rate, m/s" );


                  // Fill the GraphPane background with a color gradient


                  myPane.PaneFill = new Fill( Color.White, Color.LightYellow, 45.0F );


                  myPane.BaseDimension = 6.0F;


                  // Make up some data arrays based on the Sine function


                  PointPairList list = new PointPairLis_u40 ?);


                  for ( int i=0; i<36; i++ )


                  {


                       double x = (double) i + 5;


                       double y = 3.0 * ( 1.5 + Math.Sin( (double) i * 0.2 + (double) j ) );


                       list.Add( x, y );


                  }


                  // Add a curve to the Graph, use the next sequential color and symbol


                  LineItem myCurve = myPane.AddCurve( "Type " + j.ToString (),


                       list, ro_u97 ?tor.NextColor, rotator.NextSymbol );


                  // Fill the symbols with white to make them opaque


                  myCurve.Symbol.Fill = new Fill( Color.White );


                  // Add the GraphPane to the MasterPane


                  myMaster.Add( myPane );


              }


              Graphics g = this.ZedGraphControl.CreateGraphics();


              // Tell ZedGraph to auto layout the new GraphPanes


              myMaster.AutoPaneLayout( g, PaneLayout.ExplicitRow32 );


              myMaster.AxisChange( g );


              g.Dispose();


         }


     }


}
這一節主要是講多pane的創建方法。裡面大部分的方法和屬性在以前的章節中已經介紹過了,這裡只 想講三個地方:MasterPane類、ColorSymbolRotator類和ZOrder這個屬性的用法。
首先就是 MasterPane類。這個類就是創建多pane的類,是一個GraphPane類的集合。它裡面的大部分屬性和方法都 繼承自PaneBase和Object。像.NET一樣,這個類提供了Item和PaneList屬性來設置和獲取裡面的成員。在 程序中我們也看到了,其實MasterPane什麼也沒做,就是把其它的類一項項的Add進它的集合中。
ColorSymbolRotator類就是一個為GraphPane.AddCurve方法循環提供不同顏色和符號的類。這個 類的東西不多,我個人認為就相當於一個枚舉一樣,我們可以看到程序中只用到了rotator.NextColor rotator.NextSymbol這兩個屬性,來獲取不同的顏色和符號。
最後就是Zorder這個屬性了,在前 面的幾節中我們也見過這個屬性,可是當時我沒有講,現在我說說。Zorder就是圖形在Z軸的位置。如果 我們在平面上把左右看成X軸,把上下看成Y軸,那麼內外就是Z軸了,也就是Zorder就是圖形在內外的位 置(這個內外是針對其它圖形來說的)。我們可以看看示圖中的DRAFT這個水印的效果,這就是Zorder的功 能。如果你把程序中的
text.ZOrder = ZOrder.A_InFront;改成text.ZOrder = ZOrder.G_BehindAll;
那麼DRAFT就是如下的效果了,DRAFT就在各個Pane的下面了。
Zorder是一個枚舉共有七個枚舉值。分別是G_BehindAll、F_BehindAxisFill、E_BehindAxis、 D_BehindCurves、C_BehindAxisBorder、B_BehindLegend和A_InFront。具體的解釋如
Member Name
Description
G_BehindAll Specifies that the GraphItem will be behind all other objects (including the PaneBaseTitle). F_BehindAxisFill Specifies that the GraphItem will be behind the AxisRect background Fill (see AxisFill). E_BehindAxis Specifies that the GraphItem will be behind the Axis objects. D_BehindCurves Specifies that the GraphItem will be behind the CurveItem objects. C_BehindAxisBorder Specifies that the GraphItem will be behind the Axis border. B_BehindLegend Specifies that the GraphItem will be behind the Legend object. A_InFront Specifies that the GraphItem will be in front of all other objects, except for the other GraphItem objects that have the same ZOrder and are before this object in the GraphItemList.