本文章介紹了利用java的一個圖形控制來實現jfreechart水晶圖餅的實現代碼與效果,有需要的同學可以參考一下。
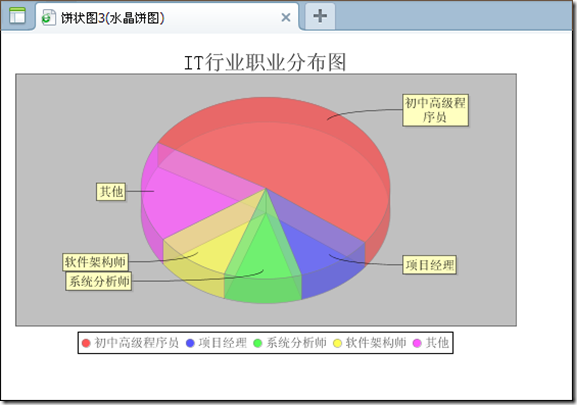
一個水晶效果的拼圖如下

實現代碼如下
代碼如下 復制代碼
<%@ page contentType="text/html;charset=GBK"%>
<%@ page
import="org.jfree.chart.*,org.jfree.chart.servlet.ServletUtilities,
org.jfree.util.Rotation,org.jfree.data.general.DefaultPieDataset,
org.jfree.chart.plot.PiePlot3D,org.jfree.chart.title.TextTitle,
java.awt.Font,org.jfree.chart.plot.PiePlot"%>
<%
//設置數據集
DefaultPieDataset dataset = new DefaultPieDataset();
dataset.setValue("初中高級程序員", 0.52);
dataset.setValue("項目經理", 0.1);
dataset.setValue("系統分析師", 0.1);
dataset.setValue("軟件架構師", 0.1);
dataset.setValue("其他", 0.18);
//通過工廠類生成JFreeChart對象
JFreeChart chart = ChartFactory.createPieChart3D("IT行業職業分布圖",
dataset, true, true, false);
//獲得3D的水晶圖對象
PiePlot3D pieplot3d = (PiePlot3D) chart.getPlot();
//設置開始角度
pieplot3d.setStartAngle(150D);
//設置方向為“順時針方向”
pieplot3d.setDirection(Rotation.CLOCKWISE);
//設置透明度,0.5F為半透明,1為不透明,0為全透明
pieplot3d.setForegroundAlpha(0.5F);
//沒有數據的時候顯示的內容
pieplot3d.setNoDataMessage("無數據顯示");
//標題文字亂碼 IT行業職業分布圖
TextTitle textTitle = chart.getTitle();
textTitle.setFont(new Font("宋體", Font.PLAIN, 20));
//餅上的文字亂碼
PiePlot plot = (PiePlot) chart.getPlot();
plot.setLabelFont(new Font("宋體", Font.PLAIN, 12));
//圖例文字亂碼 餅圖下面的5個說明
chart.getLegend().setItemFont(new Font("宋體", Font.PLAIN, 12));
String filename = ServletUtilities.saveChartAsPNG(chart, 500, 300,
null, session);
String graphURL = request.getContextPath()
+ "/DisplayChart?filename=" + filename;
%>
<html>
<head>
<title>餅狀圖3(水晶餅圖)</title>
</head>
<body>
<img src="<%=graphURL%>" width=500 height=300 border=0
usemap="#<%= filename %>">
</body>
</html>