程序師世界是廣大編程愛好者互助、分享、學習的平台,程序師世界有你更精彩!
首頁
編程語言
C語言|JAVA編程
Python編程
網頁編程
ASP編程|PHP編程
JSP編程
數據庫知識
MYSQL數據庫|SqlServer數據庫
Oracle數據庫|DB2數據庫
 程式師世界 >> 編程語言 >> 網頁編程 >> PHP編程 >> 關於PHP編程 >> PHP性能優化工具篇Benchmark類調試執行時間

PHP性能優化工具篇Benchmark類調試執行時間

編輯:關於PHP編程

這是PHP性能優化系列第二期,如何使用PEAR工具類Benchmark逐行獲取代碼或函數的執行時間。

工欲善其事,必先利其器!

如何安裝PEAR和Benchmark

請參考PHP性能優化系列第一期 [PHP性能優化准備篇圖解PEAR安裝]

Benchmark工具類包說明

直接下載:http://pear.php.net/package/Benchmark/download
Benchmark工具類包共有三個文件,分別是Timer.php、Iterate.php和Profiler.php,三個工具類功能相同,只是側重點不同,都是用於調試代碼獲取程序的執行時間。

1,Benchmark_Timer類原理與通過microtime函數獲取微秒時間再比較前後兩個時間值的差相同。
2,Benchmark_Iterate類用於調試函數的平均執行時間。
3,Benchmark_Profiler類用於統計代碼和函數的執行時間以及函數的調用次數。

具體使用方法三個文件內都有詳細的使用實例。

如何獲取一行或一段代碼的執行時間

1,通常使用microtime函數獲取代碼前後的微秒時間數再比較兩個值的時間差,如下

    <?phpfunction microtime_float(){    list($usec, $sec) = explode(" ", microtime());    return ((float)$usec + (float)$sec);} $time_start = microtime_float(); usleep(100); $time_end = microtime_float();$time = $time_end - $time_start; echo "Did nothing in $time seconds\n";?>


但這種方法很有局限制,不能大范圍的應用,而且每次都需要書寫很多代碼,適合於簡單的調試。具體請查看PHP手冊詳細說明。

2,通過使用benchmark_Timer類獲取代碼前後執行的時間差,可以同時獲取N行代碼的執行時間,操作簡單,只需要增加一個marker標記即可,請看下面Benchmark_Timer類的使用說明

如何使用Benchmark_Timer類

Benchmark_Timer類只需要在調試文件中增加Benchmark_Timer類初始化聲明和marker標注,文件尾打印各個標注處的執行時間,實例如下

    require_once 'Benchmark/Timer.php';$timer = new Benchmark_Timer();$timer->start();$timer->setMarker("marker 01");usleep(1);$timer->setMarker("marker 02");usleep(2);$timer->setMarker("marker 03");usleep(3);$timer->stop();$timer->display();


打印結果有兩種方法:

一種是表格輸出方式,$timer->display(); 如下圖

php-performance-benchmark-timer

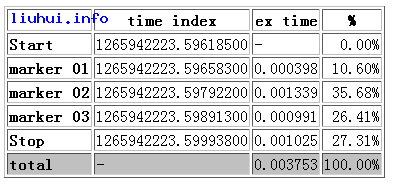
另外一種是手動var_dump或print_r打印,$timer->getProfiling();,print_r函數打印如下圖

    array0 =>array'name' => string 'Start' (length=5)'time' => string '1265942405.31334800' (length=19)'diff' => string '-' (length=1)'total' => string '-' (length=1)1 =>array'name' => string 'marker 01' (length=9)'time' => string '1265942405.31374400' (length=19)'diff' => string '0.000396' (length=8)'total' => string '0.000396' (length=8)2 =>array'name' => string 'marker 02' (length=9)'time' => string '1265942405.31423000' (length=19)'diff' => string '0.000486' (length=8)'total' => string '0.000882' (length=8)3 =>array'name' => string 'marker 03' (length=9)'time' => string '1265942405.31519200' (length=19)'diff' => string '0.000962' (length=8)'total' => string '0.001844' (length=8)4 =>array'name' => string 'Stop' (length=4)'time' => string '1265942405.31623800' (length=19)'diff' => string '0.001046' (length=8)'total' => string '0.002890' (length=8)


結果說明
1,name表示標注名稱,如上 包含兩個特殊標注start和stop表示開始和結束,其次是自定義標注 marker 01 marker 02等
2,time表示當前的微秒時間
3,diff表示上一個標記到當前標記的執行時間,這個就是我們需要獲取的時間差,沒錯,看的就是這個值。
4,total表示執行到當前的整個時間

如何使用Benchmark_Iterate類

Benchmark_Iterate類用於調試函數執行的平均時間,與Benchmark_Timer類不同在於可以多次調用同一個函數獲取其執行時間的平均值,實例如下:

    require_once "Benchmark/Iterate.php";$bench = new Benchmark_Iterate;function test($i){    echo $i;}$bench->run(100,"test",10);var_dump($bench->get());


通過調用test函數100次獲取平均執行時間,結果如下

    array1 => string '0.000486' (length=8)2 => string '0.000466' (length=8).............................(中間省略)99 => string '0.000479' (length=8)100 => string '0.000467' (length=8)'mean' => string '0.000476' (length=8)'iterations' => int 100


結果說明
1,每個數字表示每次調用的時間
2,mean表示函數執行的平均時間,如上調用100次test函數的平均時間為0.000476
3,iterations表示函數調用的次數

如何使用Benchmark_Profiler類


Benchmark_Profiler類用於統計函數的執行次數和執行時間等,實例如下:

    require_once 'Benchmark/Profiler.php';$profiler = new Benchmark_Profiler(TRUE);function myFunction() {    global $profiler;     $profiler->enterSection('myFunction');     //do something     $profiler->leaveSection('myFunction');     return;}//do somethingmyFunction();//do more


結果如下

php-performance-benchmark-profiler

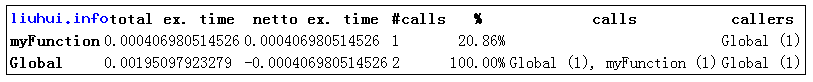
Benchmark_Profiler類在實際性能調試中使用並不多,因為還有比這個更好的工具,如xDebuger等,因此可直接忽略!

Benchmark 工具類在使用調試中針對逐行調試來分析程序性能問題非常實用,主要使用Benchmark_Timer類調試各代碼段的時間點,以通過獲取執行時間來優化程序提高代碼的性能。這裡就不再深入討論,如果在使用的過程中有什麼問題歡迎大家一起交流!

如果你發現這種逐行調試很累很辛苦,如果你想從整體上把握程序的性能情況,這個Benchmark類調試工具就不能滿足你的需求,下期將討論PHP性能調試工具xDebuger的安裝與使用。

相關資料

microtime

(PHP 3, PHP 4, PHP 5)

microtime -- 返回當前 Unix 時間戳和微秒數
說明
mixed microtime ( [bool get_as_float] )

microtime() 當前 Unix 時間戳以及微秒數。本函數僅在支持 gettimeofday() 系統調用的操作系統下可用。
如果調用時不帶可選參數,本函數以 "msec sec" 的格式返回一個字符串,其中 sec 是自 Unix 紀元(0:00:00 January 1, 1970 GMT)起到現在的秒數,msec 是微秒部分。字符串的兩部分都是以秒為單位返回的。

如果給出了 get_as_float 參數並且其值等價於 TRUE,microtime() 將返回一個浮點數。

注意: get_as_float 參數是 PHP 5.0.0 新加的。

擴展資料
PHP Benchmark/Timer Class
PHP Benchmark
Benchmark and Optimize PHP Script Speed

  1. 上一頁:
  2. 下一頁:
Copyright © 程式師世界 All Rights Reserved