本文實例講述了phplot生成圖片類用法。分享給大家供大家參考。具體分析如下:
phplot是一個利用php的圖象函數編寫的一個自動生成類,首先申明一下,我對他也只是了解. 在原來的有些版本好象還需要多方面的配置和支持,不過現在都用的是php5系列了,大家只要了解一些常用到的函數,就比如我們學習一種軟件一樣,只需要懂得怎樣使用他就可以了,如果感興趣的朋友可以深入的學習學習,不過對於我們大多數的朋友來說,只要會使用他就可以了,畢竟也不是常用,只是需要用php作圖的時候才用到他。所以我們只需要知道他怎麼用就可以了,那麼就必須知道他的函數的作用,好比我們學習discuz一樣,要懂得怎麼用他就可以了!
他的常用函數分為幾個類:配置函數,顯示函數,顏色函數.
1.配置函數:配置phplot使用什麼樣的類型,以及以什麼樣的方式顯示圖象。
a.SetDataType($which_dt):設定使用的數據類型,在這個裡面可以使用多種類型。
(1)text-date:數據沿著x柱,等間距排行。每個數組元素代表x軸上的某一位置的點,他同時也是數組,第一個元素代表x坐標,後面的所有元素都代表y坐標。
(2) data-data:與上面的類型相似,不同的是數值數組的第二個元素代表x坐標,後面的代表y坐標,而第一個元素僅僅是一個標簽。
(3)data-data-error:與data-data類似,不同的是他的數值數組後面還有兩個元素代表error_plus和error_minus,如
(data_labl,x_position,y_position,error_plus,error_minus).
b.SetDataValues($which_dv):把一個數組$which_dv賦給類的一個變量$this->data_values.這個函數要開始作圖之前調用。
c.SetPlotType($which_pt):設定圖表的類型,可以是bars,lines,linepoints,area,points,pie等。
d.SetErrorBarLineWidth($wd):設定錯誤欄的寬度。
e.SetFileFormat($which_file_format):設定輸出的圖象文件的格式,可以是GIF,PNG,JPEG等。還有要看你的GD庫是否支持。
f.SetUseTTF($which_ttf):設定是否使用TTF,如果編譯php支持TTF,就使用SetUseTTF("1");否則設置為0.
2.顯示函數:顯示圖象設定輸出圖表所使用的線條的類型,寬度等參量,還可以設定坐標軸刻度的間距,圖表的大小等。
a.SetErrorBarShape($which_ebs):設定精度線的類型,可以是line或者是tee,如果是tee,則T型線的半度設定為SetErrorBarSize.
b.SetErrprBarSize($which_ebs):設置精度線的寬度。
c.SetHorizTickIncreament($which_ti):設定x軸的顯示刻度的間距。
d.SetHorizTicks($whick_nt):設定x軸顯示刻度的個數。(不能和SetHorizTickIncreament)
e.SetNumVertTicks($which_nt):設定x軸顯示刻度的個數。(不能和SetVertTickIncreament)
f.SetPlotArearpixels($x1,$y1,$x2,$y2):設定圖表大小。
g.SetPointShape($which_pt):設置定點的形狀:rect,circle,diamond,triangle,dot,line,halfline.
h.SetPointSize($whick_ps教程):設定點的寬度。
i.SetPrecisionX($whick_prec):設定x軸的精度。$whick_prec代表小數點後面數字的個數。
j.SetPrecisiony($whick_prec)設定y軸的精度。$whick_prec代表小數點後面數字的個數。
k.SetSjading($whick_s):設定陰影的寬度。
l.SetTickLength($which_tl):設定坐標軸上的標記線的長度,單位為pixel.
m.SetTile($title):設定圖表的標題。
n.SetVertTickIncreament($whick_ti):和SetHorizTicks($whick_nt)這兩個函數用於設定坐標軸上標記線的垂直和水平間隔。
o.SetXDataLabelMaxlength($which_xdlm):設定x軸上的標簽的最大長度。
p.SetXGridLabelType($which_xtf):設定x軸的標簽類型,可以是time,title,data,none或者default.
(1).time:由函數strftime()設定。
(2).title:文本類型。
(3).data:用函數number_format()格式化數字。
(4).none:沒有任何標簽。
(5).default:按照輸入的形式輸出.
3.顏色函數:顏色函數用於設定圖表中的各元素的顯示顏色,包括圖象背景顏色,刪格線的顏色,標題顏色等!
a.SetBackgroundColor($which_color):設定整個圖象的背景顏色。
b.SetGridColor($which_color):設定刪格線的顏色。
c.SetLegend($which_legend):參數是一個文本數組,他的內容顯示在一個圖列框中。
d.SetLegendPixels($which_x,$which_y,$which_type):設定圖列框左下角點的坐標,最後一個參數以後可用。
e.SetLightGridColor($which_color):刪割線線有兩種顏色,這個函數設定其中的一種。
f.SetLineWidth($which_lt):設定圖表中使用的線寬,他也影響精度線的寬度。
g.SetLineStyles($which_sls):設定線條的類型,可以是實線或者虛線。
h.SetPlotBgColor($which_color):設定使用SetPlotAreaPixels()函數設定的區域的顏色。
i.SetTextColor($which_color):設定文本的顏色,默認是黑色。
j.SetTickColor($which_color):設定坐標軸上刻線的顏色。
k.SetTitleColor($which_color):設定標題顏色。
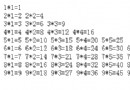
看個實例,生成上面圖形的代碼如下:
代碼如下:# PHPlot Demo
# 2008-01-09 ljb
# For more information see http://sourceforge.net/projects/phplot/
# Load the PHPlot class library:
require_once 'phplot.php';
# Define the data array: Label, the 3 data sets.
# Year, Features, Bugs, Happy Users:
$data = array(
array('2001', 60, 35, 20),
array('2002', 65, 30, 30),
array('2003', 70, 25, 40),
array('2004', 72, 20, 60),
array('2005', 75, 15, 70),
array('2006', 77, 10, 80),
array('2007', 80, 5, 90),
);
# Create a PHPlot object which will make a 600x400 pixel image:
$p = new PHPlot(600, 400);
# Use TrueType fonts:
$p->SetDefaultTTFont('./arial.ttf');
# Set the main plot title:
$p->SetTitle('PHPlot Customer Satisfaction (estimated)');
# Select the data array representation and store the data:
$p->SetDataType('text-data');
$p->SetDataValues($data);
# Select the plot type - bar chart:
$p->SetPlotType('bars');
# Define the data range. PHPlot can do this automatically, but not as well.
$p->SetPlotAreaWorld(0, 0, 7, 100);
# Select an overall image background color and another color under the plot:
$p->SetBackgroundColor('#ffffcc');
$p->SetDrawPlotAreaBackground(True);
$p->SetPlotBgColor('#ffffff');
# Draw lines on all 4 sides of the plot:
$p->SetPlotBorderType('full');
# Set a 3 line legend, and position it in the upper left corner:
$p->SetLegend(array('Features', 'Bugs', 'Happy Users'));
$p->SetLegendWorld(0.1, 95);
# Turn data labels on, and all ticks and tick labels off:
$p->SetXDataLabelPos('plotdown');
$p->SetXTickPos('none');
$p->SetXTickLabelPos('none');
$p->SetYTickPos('none');
$p->SetYTickLabelPos('none');
# Generate and output the graph now:
$p->DrawGraph();