進程的運行,必須使用內存。下圖是Linux中進程中的內存的分布圖:
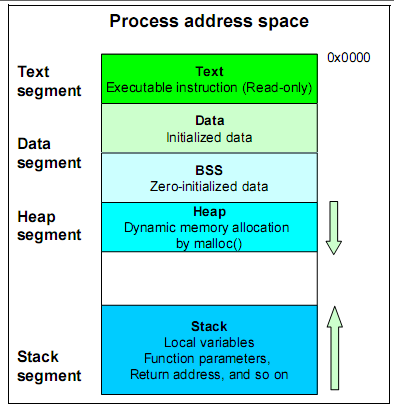
其中最重要的 heap segment 和 stack segment。其它內存段基本是大小固定的。注意stack是向低地址增長的,和heap相反。另外進程的內存地址從0開始,是因為使用的是虛擬內存。所以存在虛擬內存到物理內存的映射。目前服務器一般都是64位的,32位的已經極少了,32為對內存有極大限制。
1. Linux 虛擬內存
Linux是通過虛擬內存的方式來管理內存的。虛擬內存和物理內存之間存在映射關系。當進程在CPU上運行時,虛擬內存就會映射到物理內存,供CPU來訪問。
applications do not allocate physical memory, but request a memory map of a certain size at the Linux kernel and in exchange receive a map in virtual memory. As you can see, virtual memory does not necessarily have to be mapped into physical memory. If your application allocates a large amount of memory, some of it might be mapped to the swap file on the disk subsystem.
圖示 進程虛擬內存 = 進程物理內存 + 進程swap(page out):
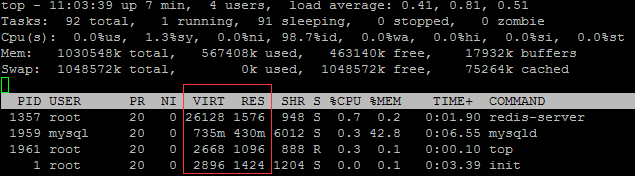
上圖是top命令的截圖,可以看到:mysqld 使用的虛擬內存為 735M,而常駐物理內存為 430M,所以其余的305M被swap out了(實際上是延遲分配)。
VIRT:The total amount of virtual memory used by the task. It includes all code, data and shared libraries plus pages that have been swapped out.
RES: Resident size (kb)。The non-swapped physical memory a task is using(常駐內存).
Linux handles the memory resource far more efficiently. The default configuration of the virtual memory manager allocates all available free
memory space as disk cache. Hence it is not unusual to see productive Linux systems that boast gigabytes of memory but only have 20 MB of that memory free. In the same context, Linux also handles swap space very efficiently. Swap space being used does not indicate a memory bottleneck but proves how efficiently Linux handles system resources.
There is no need to be alarmed if you find the swap partition filled to 50%. The fact that swap space is being used does not indicate a memory bottleneck; instead it proves how efficiently Linux handles system resources.
可見,系統顯示空閒的內存很少,並不表示真的存在內存瓶頸;swap分區被使用了,也不代表存在內存瓶頸。
內存的分配:
Linux 管理內存是通過內存page為單位的,一般一個page為4K。Linux通過一個維持一個free內存的列表來管理和分配內存,並且維持內存的連續,防止內存碎片的產生。該系統被稱為buddy system。內存的分配和管理全依靠buddy system.
內存的回收(page frame reclaiming):
當空閒內存不足時,就涉及到內存的回收。內存的回收有兩種方式:回收用於緩存磁盤文件的 page cache(disk cache);swap out/page out 其它非活躍進程的內存;而且優先回收用於文件緩存的內存(disk cache):
When kswapd reclaims pages, it would rather shrink the page cache than page out (or swap out) the pages owned by processes.
然後會掃描內存的 active list 和 inactive list,根據LRU原則將active的page移到inactive,然後將inactive list中的page swap out.
active list 和 inactive list,可以用vmstat -a 查看到:
[root@localhost ~]# vmstat -a
procs -----------memory---------- ---swap-- -----io---- --system-- -----cpu-----
 r  b   swpd   free  inact active   si   so    bi    bo   in   cs us sy id wa st
 0  0      0 462024  72680 471416    0    0    75     6  182  107  1 13 85  0  0
kswapd: kernel swap daemon
內存的兩大主要用處:
The pages are used mainly for two purposes: page and process address space. The page cache is pages mapped to a file on disk. The
cache pages that belong to a process address space (called anonymous memory because it is not mapped to any files, and it has no name) are used for heap and stack.
一、disk cache(page cache, file cache);
二、進程使用(anonymous memory、heap 和 stack)
kswapd 處理swap in 和swap out; 而 pdflush 處理disk cache到磁盤的刷新。
2. 如何盡量避免swap對mysql的影響
控制系統kswapd在內核中有一個專門的參數:
[root@localhost ~]# cat /proc/sys/vm/swappiness
60
我們把 vm.swappiness = 0 設置好,就可以在內存不足時,盡量避免系統發生swap,而盡量去 flush disk cache. 但是最新的Linux內核修改了對vm.swappingness=0 的解釋,如果設置成0,可能會發生00M,而將mysqld給kill掉。新內核(2.6.32-303.el6及以後)推薦的做法是:
1)盡量保證Linux操作系統還有足夠的內存;
2)最新的內核,建議把vm.swappiness設置1;
3)考慮設置 /proc/$(pidof -s mysqld)/oom_adj為較小的值來盡量避免MySQL由於內存不足而被關閉。
具體參見:http://www.woqutech.com/?p=1397
3. 如何修改 oom_adj 值
查看mysqld的oom_ajd值:
[root@localhost ~]# cat /proc/`pidof -s mysqld`/oom_adj
0
[root@localhost ~]# cat /proc/$(pidof -s mysqld)/oom_adj
0
默認值為0. 當我們設置為-17時,對於該進程來說,就不會觸發OOM機制,被殺掉。修改:
[root@localhost ~]# echo -17 > /proc/$(pidof mysqld)/oom_adj
[root@localhost ~]# cat /proc/$(pidof mysqld)/oom_adj
-17
這裡為什麼是-17呢?這和Linux的實現有關系。在Linux內核中的oom.h文件中,可以看到下面的定義:
 /* /proc//oom_adj set to -17 protects from the oom-killer */

#define OOM_DISABLE (-17)

/* inclusive */

#define OOM_ADJUST_MIN (-16)

#define OOM_ADJUST_MAX 15
這個oom_adj中的變量的范圍為15到-16之間。越大越容易被kill。oom_score就是它計算出來的一個值,就是根據這個值來選擇哪些進程被kill掉的。
總之,通過上面的分析可知,滿足下面的條件後,就是啟動OOM機制。
1) VM裡面分配不出更多的page(注意linux kernel是延遲分配page策略,及用到的時候才alloc;所以malloc + memset才有效)。
2) 用戶地址空間不足,這種情況在32bit機器上及user space超過了3GB,在64bit機器上不太可能發生。
具體參見:http://blog.chinaunix.net/uid-20788636-id-4308527.html
其實設置mysqld的oom_adj不是最好的選擇,mysqld不會被kill,必然就會導致其它進程被kill掉;最好還是保障內存充足或者設置vm.swappiness=1比較好
4. 內存瓶頸的檢測
Linux內存的瓶頸,主要在於查看是否有比較嚴重的 swap 的發生(swap out/page out)。其它空虛內存的大小,swap分區被使用都不能說明說明問題。
區分 swap out 和 page out:
Page out moves individual pages to swap space on the disk; swapping is a bigger operation that moves the entire address space of a process to swap space in one operation.(page out 是指將單獨的page交換到磁盤,而swap out是指將整個進程的內存交換到磁盤)
使用 vmstat 從整個系統層面查看swap out:
[root@localhost ~]# vmstat 2
procs -----------memory---------- ---swap-- -----io---- --system-- -----cpu-----
 r  b   swpd   free   buff  cache   si   so    bi    bo   in   cs us sy id wa st
 0  0      0 400776  55292  82416    0    0    33     5  103   87  0  6 94  0  0
 0  0      0 400768  55292  82416    0    0     0     0   54   65  0  2 98  0  0
 0  0      0 400768  55292  82416    0    0     0     0   69   72  0  3 97  0  0
 0  0      0 400644  55300  82416    0    0     0    18   67   79  0  3 97  0  0
 0  0      0 400644  55300  82416    0    0     0     0   51   61  0  2 98  0  0
 0  0      0 400644  55300  82416    0    0     0     0   64   69  0  2 98  0  0
 0  0      0 400644  55308  82416    0    0     0    20   58   73  0  2 98  0  0
其中的 swap si: 表示每秒 swap in; so:表示每秒swap out;
   Swap
       si: Amount of memory swapped in from disk (/s).
       so: Amount of memory swapped to disk (/s).
使用 sar -B 從整個系統層面查看page out:
[root@localhost ~]# sar -B
Linux 2.6.32-504.el6.i686 (localhost.localdomain)       10/01/2015      _i686_  (1 CPU)

10:57:33 AM       LINUX RESTART

11:00:01 AM  pgpgin/s pgpgout/s   fault/s  majflt/s  pgfree/s pgscank/s pgscand/s pgsteal/s    %vmeff
11:10:01 AM     39.84      4.85    340.32      0.21     39.40      0.00      0.00      0.00      0.00
11:20:01 AM      0.06      2.76     10.69      0.00      3.21      0.00      0.00      0.00      0.00
11:30:01 AM      0.14      2.68     10.16      0.00      3.08      0.00      0.00      0.00      0.00
11:40:01 AM     69.58     13.07    154.16      0.01     47.29      0.00      0.00      0.00      0.00
11:50:01 AM      1.84      3.93     28.39      0.02      9.17      0.00      0.00      0.00      0.00
12:00:01 PM      0.00      3.20     19.70      0.00     10.87      0.00      0.00      0.00      0.00
12:10:01 PM      0.01      2.90     31.96      0.00      8.77      0.00      0.00      0.00      0.00
12:20:01 PM      0.06      3.06     40.04      0.00     10.98      0.00      0.00      0.00      0.00
12:30:02 PM      2.17      3.81     81.19      0.02     21.63      0.00      0.00      0.00      0.00
Average:        12.62      4.47     79.63      0.03     17.15      0.00      0.00      0.00      0.00

03:01:38 PM       LINUX RESTART

03:10:01 PM  pgpgin/s pgpgout/s   fault/s  majflt/s  pgfree/s pgscank/s pgscand/s pgsteal/s    %vmeff
03:20:01 PM      6.22      3.99     93.05      0.04     22.89      0.00      0.00      0.00      0.00
Average:         6.22      3.99     93.05      0.04     22.89      0.00      0.00      0.00      0.00
[root@localhost ~]# sar -B 2 3
Linux 2.6.32-504.el6.i686 (localhost.localdomain)       10/01/2015      _i686_  (1 CPU)

03:24:05 PM  pgpgin/s pgpgout/s   fault/s  majflt/s  pgfree/s pgscank/s pgscand/s pgsteal/s    %vmeff
03:24:07 PM      0.00      0.00     26.63      0.00     30.15      0.00      0.00      0.00      0.00
03:24:09 PM      0.00      0.00     19.70      0.00     30.30      0.00      0.00      0.00      0.00
03:24:11 PM      0.00      0.00     15.00      0.00     30.00      0.00      0.00      0.00      0.00
Average:         0.00      0.00     20.44      0.00     30.15      0.00      0.00      0.00      0.00
sar -B 取的是從系統啟動到目前的平均值;sar -B 2 3 是指每隔2秒取值,總共取值3次。輸出字段的含義如下:
       -B     Report  paging  statistics. Some of the metrics below are available only with post 2.5
              kernels. The following values are displayed:

              pgpgin/s
                     Total number of kilobytes the system paged in from disk per second.  Note: With
                     old  kernels (2.2.x) this value is a number of blocks per second (and not kilo-
                     bytes).

              pgpgout/s
                     Total number of kilobytes the system paged out to disk per second.  Note:  With
                     old  kernels (2.2.x) this value is a number of blocks per second (and not kilo-
                     bytes).

              fault/s
                     Number of page faults (major + minor) made by the system per second.   This  is
                     not  a  count of page faults that generate I/O, because some page faults can be
                     resolved without I/O.

              majflt/s
                     Number of major faults the  system  has  made  per  second,  those  which  have
                     required loading a memory page from disk.

              pgfree/s
                     Number of pages placed on the free list by the system per second.

              pgscank/s
                     Number of pages scanned by the kswapd daemon per second.

              pgscand/s
                     Number of pages scanned directly per second.

              pgsteal/s
                     Number  of  pages the system has reclaimed from cache (pagecache and swapcache)
                     per second to satisfy its memory demands.

              %vmeff
                     Calculated as pgsteal / pgscan, this is a metric  of  the  efficiency  of  page
                     reclaim.  If  it is near 100% then almost every page coming off the tail of the
                     inactive list is being reaped. If it gets too low (e.g. less than 30%) then the
                     virtual  memory  is having some difficulty.  This field is displayed as zero if
                     no pages have been scanned during the interval of time.
pgpgout/s 表示就是每秒的page out 的KB數量。majflt/s 也是極為重要的指標,該指標涉及到虛擬內存的 page fault機制。
虛擬內存的 page fault機制:
linux 使用虛擬內存層來映射物理地址空間,這種映射在某種意義上是說當一個進程開始運行,內核僅僅映射其需要的那部分,內核首先會搜索 CPU緩存和物理內存,如果沒有找到內核則開始一次 MPF, 一次 MPF 即是一次對磁盤子系統的請求,它將數據頁從磁盤和緩存讀入 RAM。一旦內存頁被映射到高速緩沖區,內核便會試圖使用這些頁,被稱作 MnPF,MnPF 通過重復使用內存頁而縮短了內核時間。
文件緩沖區(disk cache)可使內核減少對 MPFs 和 MnPFs 的使用, 隨著系統不斷地 IO 操作, 緩沖區會隨之增大, 直至內存空閒空間不足並開始回收.
使用 free 查看空閒內存:
[root@localhost ~]# free
             total       used       free     shared    buffers     cached
Mem:       1030548     630284     400264        220      55388      82428
-/+ buffers/cache:     492468     538080
Swap:      1048572          0    1048572
[root@localhost ~]# free -m
             total       used       free     shared    buffers     cached
Mem:          1006        616        390          0         54         80
-/+ buffers/cache:        481        524
Swap:         1023          0       1023
1g的內存,1g的swap分區,使用了616M,空閒390M; swap分區沒有被使用,全部空閒。
其實free內存很小不能說明問題,但是free比較大,卻能說明內存充足。
swap如果大部分被使用,或者全部使用也能說明 swap 嚴重,當然最好結合 vmstat 來綜合考慮。
使用 ps -mp 1959 -o THREAD,pmem,rss,vsz,tid,pid 查看mysqld的內存和CPU使用情況:
[root@localhost ~]# pidof -s mysqld
1959
[root@localhost ~]# ps -mp 1959 -o THREAD,pmem,rss,vsz,tid,pid
USER     %CPU PRI SCNT WCHAN  USER SYSTEM %MEM   RSS    VSZ   TID   PID
mysql     0.6   -    - -         -      - 42.8 441212 752744    -  1959
mysql     0.1  19    - -         -      -    -     -      -  1959     -
mysql     0.0  19    - -         -      -    -     -      -  1962     -
mysql     0.0  19    - -         -      -    -     -      -  1963     -
mysql     0.0  19    - -         -      -    -     -      -  1964     -
mysql     0.0  19    - -         -      -    -     -      -  1965     -
mysql     0.0  19    - -         -      -    -     -      -  1966     -
mysql     0.0  19    - -         -      -    -     -      -  1967     -
mysql     0.0  19    - -         -      -    -     -      -  1968     -
mysql     0.0  19    - -         -      -    -     -      -  1969     -
mysql     0.0  19    - -         -      -    -     -      -  1970     -
mysql     0.0  19    - -         -      -    -     -      -  1971     -
mysql     0.0  19    - -         -      -    -     -      -  1973     -
mysql     0.0  19    - -         -      -    -     -      -  1974     -
mysql     0.0  19    - -         -      -    -     -      -  1975     -
mysql     0.0  19    - -         -      -    -     -      -  1976     -
mysql     0.0  19    - -         -      -    -     -      -  1977     -
mysql     0.0  19    - -         -      -    -     -      -  1978     -
mysql     0.0  19    - -         -      -    -     -      -  1979     -
mysql     0.0  19    - -         -      -    -     -      -  1980     -
mysql     0.0  19    - -         -      -    -     -      -  1981     -
mysql     0.0  19    - -         -      -    -     -      -  1982     -
使用 pmap 查看進程的內存分布情況:
The pmap command reports the memory map of a process or processes.
[root@localhost ~]# pmap -x 1959
1959:   /usr/local/mysql/bin/mysqld --basedir=/usr/local/mysql --datadir=/var/lib/mysql --plugin-dir=/usr/local/mysql/lib/plugin --user=mysql --log-error=/var/log/mysqld.log --pid-file=/var/mysql/mysqld.pid --socket=/var/lib/mysql/mysql.sock
Address   Kbytes     RSS   Dirty Mode   Mapping
00297000       4       4       0 r-x--    [ anon ]
002e0000      48      20       0 r-x--  libnss_files-2.12.so
002ec000       4       4       4 r----  libnss_files-2.12.so
002ed000       4       4       4 rw---  libnss_files-2.12.so
003fb000     116      60       0 r-x--  libgcc_s-4.4.7-20120601.so.1
00418000       4       4       4 rw---  libgcc_s-4.4.7-20120601.so.1
0041b000      28       8       0 r-x--  libcrypt-2.12.so
00422000       4       4       4 r----  libcrypt-2.12.so
00423000       4       4       4 rw---  libcrypt-2.12.so
00424000     156       0       0 rw---    [ anon ]
0044d000     368     148       0 r-x--  libfreebl3.so
004a9000       4       0       0 -----  libfreebl3.so
004aa000       4       4       4 r----  libfreebl3.so
004ab000       4       4       4 rw---  libfreebl3.so
004ac000      16      12      12 rw---    [ anon ]
0053e000     120     100       0 r-x--  ld-2.12.so
0055c000       4       4       4 r----  ld-2.12.so
0055d000       4       4       4 rw---  ld-2.12.so
00560000       4       4       0 r-x--  libaio.so.1.0.1
00561000       4       4       4 rw---  libaio.so.1.0.1
00564000    1600     680       0 r-x--  libc-2.12.so
006f4000       8       8       8 r----  libc-2.12.so
006f6000       4       4       4 rw---  libc-2.12.so
006f7000      12      12      12 rw---    [ anon ]
006fc000      92      84       0 r-x--  libpthread-2.12.so
00713000       4       4       4 r----  libpthread-2.12.so
00714000       4       4       4 rw---  libpthread-2.12.so
00715000       8       4       4 rw---    [ anon ]
00719000      12       8       0 r-x--  libdl-2.12.so
0071c000       4       4       4 r----  libdl-2.12.so
0071d000       4       4       4 rw---  libdl-2.12.so
00720000      28      16       0 r-x--  librt-2.12.so
00727000       4       4       4 r----  librt-2.12.so
00728000       4       4       4 rw---  librt-2.12.so
0072b000     160      28       0 r-x--  libm-2.12.so
00753000       4       4       4 r----  libm-2.12.so
00754000       4       4       4 rw---  libm-2.12.so
07b14000     900     400       0 r-x--  libstdc++.so.6.0.13
07bf5000      16      16      12 r----  libstdc++.so.6.0.13
07bf9000       8       8       8 rw---  libstdc++.so.6.0.13
07bfb000      24       8       8 rw---    [ anon ]
08048000   12096    4284       0 r-x--  mysqld
08c18000    1224     468     304 rw---  mysqld
08d4a000     256     252     252 rw---    [ anon ]
0a809000    5492    5396    5396 rw---    [ anon ]
8abfd000       4       0       0 -----    [ anon ]
8abfe000   10240       4       4 rw---    [ anon ]
8b5fe000       4       0       0 -----    [ anon ]
8b5ff000   10240       4       4 rw---    [ anon ]
8bfff000       4       0       0 -----    [ anon ]
8c000000   10240       8       8 rw---    [ anon ]
8ca00000    1024     436     436 rw---    [ anon ]
8cbf7000       4       0       0 -----    [ anon ]
8cbf8000   10240      16      16 rw---    [ anon ]
8d5f8000       4       0       0 -----    [ anon ]
8d5f9000   10240       8       8 rw---    [ anon ]
8dff9000       4       0       0 -----    [ anon ]
8dffa000   10240       4       4 rw---    [ anon ]
8e9fa000       4       0       0 -----    [ anon ]
8e9fb000   10240       4       4 rw---    [ anon ]
8f3fb000       4       0       0 -----    [ anon ]
8f3fc000   10240       4       4 rw---    [ anon ]
8fdfc000       4       0       0 -----    [ anon ]
8fdfd000   12720    2468    2468 rw---    [ anon ]
90c00000     132       4       4 rw---    [ anon ]
90c21000     892       0       0 -----    [ anon ]
90d04000       4       0       0 -----    [ anon ]
90d05000     192      12      12 rw---    [ anon ]
90d35000       4       0       0 -----    [ anon ]
90d36000   10240       4       4 rw---    [ anon ]
91736000       4       0       0 -----    [ anon ]
91737000   10240       4       4 rw---    [ anon ]
92137000       4       0       0 -----    [ anon ]
92138000   10240       4       4 rw---    [ anon ]
92b38000       4       0       0 -----    [ anon ]
92b39000   10240       4       4 rw---    [ anon ]
93539000       4       0       0 -----    [ anon ]
9353a000   10240       4       4 rw---    [ anon ]
93f3a000       4       0       0 -----    [ anon ]
93f3b000   10240       4       4 rw---    [ anon ]
9493b000       4       0       0 -----    [ anon ]
9493c000   10240       4       4 rw---    [ anon ]
9533c000       4       0       0 -----    [ anon ]
9533d000   10240       4       4 rw---    [ anon ]
95d3d000       4       0       0 -----    [ anon ]
95d3e000   10240       8       8 rw---    [ anon ]
9673e000       4       0       0 -----    [ anon ]
9673f000  133548   19940   19940 rw---    [ anon ]
9e9ab000  407108  406096  406096 rw---    [ anon ]
b774b000       4       4       4 rw---    [ anon ]
bfc28000      84      56      56 rw---    [ stack ]
-------- ------- ------- ------- -------
total kB  752740       -       -       -
上面字段的含義:
EXTENDED AND DEVICE FORMAT FIELDS
       Address:   start address of map
       Kbytes:    size of map in kilobytes
       RSS:       resident set size in kilobytes
       Dirty:     dirty pages (both shared and private) in kilobytes
       Mode:      permissions on map: read, write, execute, shared, private (copy on write)
       Mapping:   file backing the map, or ’[ anon ]’ for allocated memory, or  ’[ stack ]’ for the program stack
       Offset:    offset into the file
       Device:    device name (major:minor)
Mapping 字段說明是通過文件map使用的內存,還是[ anon ] 實際分配的內存,還是[ stack ] 棧使用的內存。
最後一行的 total KB 752740 的結果 和上面一條命令中 VSZ: 752744(虛擬內存) 是一致的。
5. 內存的調優
上面我們說到內存的瓶頸,主要看 swap out, page out, major page fault. 它們會極大的影響性能,特別是swap out. 所以內存調優也就是減少和防止它們的出現。
1)使用 hugepage 可以避免swap out; 但是 huagepage也是有代價的(導致page爭用加劇),一定要事先測試;
2)修改 vm.swapingness, 優先flush disk cache,盡量減少page out 和 swap out; 但是flush disk cache又可能會導致 major page fault的產生;
3)disk cache刷新到磁盤有兩個內核參數調節:vm.dirty_background_ratio=10; 默認值為10,表示disk cache中的髒頁數量達到10%時,pdflush內核
線程會被調用,異步刷新disk cache; vm.dirty_ratio=20; 默認值20,表示disk cache中的髒頁數量達到20%時,會進行同步的disk cache刷新,從而
會阻塞系統中應用進程的IO操作!我們可以調低vm.dirty_background_ratio來降低disk cache對mysql使用內存的影響,但是可能會增加磁盤IO;
4)加內存;