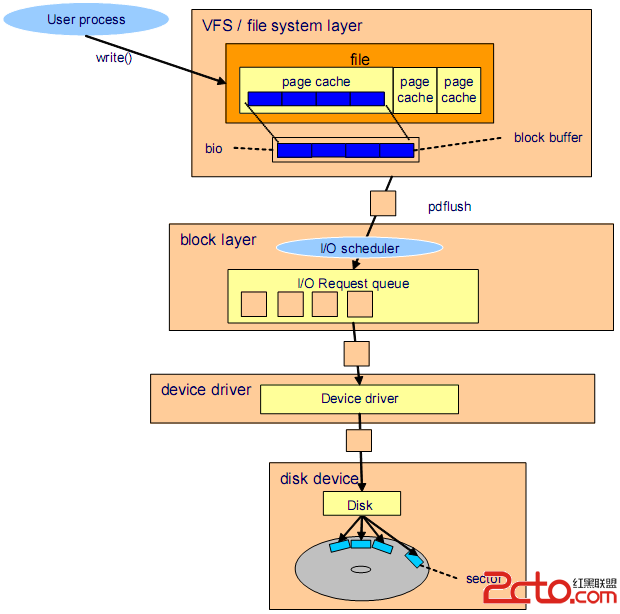
 可以看到IO操作分成了四個層面:
1)文件系統緩存:處理數據必須先從磁盤讀到緩存,然後修改,然後刷會磁盤。緩存的刷新涉及到兩個參數:vm.dirty_background_ratio、vm.dirty_ratio。還有刷新寫回時,使用到 bio 結構,bio的組成是由磁盤上相鄰的block組成的,所以這裡進行了優化。
2)block layer:該層就涉及到 IO調度算法,IO調度算法在mysql服務器是一個很重要的調優手段。系統中所有進程申請的IO操作,全部在這裡進行排隊,等待調度,然後寫回磁盤。調度算法有四種:
1> Anticipatory: 適用於個人PC,單磁盤系統;
2> CFQ(Complete Fair Queuing):默認的IO調度算法,完全公平的排隊調度算法。每一個進程的IO請求會安排進一個專門的IO隊列,然後按照進程組來公平的調度IO,也就是每一個進程組之間按照公平的方式來調度IO。顯然他適合多用戶的系統,但是極為不適合作為數據庫系統的IO調度算法,因為顯而易見,數據庫系統中,數據庫進程肯定是IO最多的一個進程組,然後它卻只能獲得和其它進程一樣多的IO調度機會。所以顯然這是極為不合理的。數據庫系統絕對不要使用該調度算法。
3> Deadline: 按照截止期限來循環在各個IO隊列中進行調度,所以它提供了一個近實時的IO系統,並且磁盤throughput也很好,也不會造成starvation.一般mysql系統建議采用該調度算法。
4> NOOP: 簡單的FIFO隊列進行調度,No operation的意思是,它沒有進行額外的將臨近的IO進行合並的操作,所以它對CPU的使用極少。該調度算法特別適合於SSD。因為SSD在對待順序IO和隨機IO沒有什麼區別。所以它不需要對臨近的IO進行合並。避免了合並操作對CPU的使用。
所以一般而言,對於mysql的系統,如果是SSD,那麼應該使用NOOP調度算法,如果是磁盤,就應該使用Deadline調度算法。
查看與修改IO調度算法:
臨時修改:
[root@localhost ~]# cat /sys/block/sda/queue/scheduler
noop anticipatory deadline [cfq]
[root@localhost ~]# echo noop > /sys/block/sda/queue/scheduler
[root@localhost ~]# cat /sys/block/sda/queue/scheduler
[noop] anticipatory deadline cfq
永久修改:
# vi /boot/grub/menu.lst
更改到如下內容:
kernel /boot/vmlinuz-2.6.18-8.el5 ro root=LABEL=/ elevator=deadline rhgb quiet
重啟之後,查看調度方法:
# cat /sys/block/sda/queue/scheduler
noop anticipatory [deadline] cfq
已經是deadline了
3)磁盤驅動層:對於順序讀系統而言,很容易在磁盤接口層的帶寬上成為瓶頸所在;
4)磁盤:對於隨機讀多的系統而言,磁盤很容易成為瓶頸所在,一般的優化就是使用RAID或者換SSD;
2. IO瓶頸檢測
2.1 使用 iostat 查看磁盤IO
顯示單位問題:默認iostat是以磁盤的block為單位,也可以使用 -k 來指定以 kilobytes 為單位,或者使用 -m 指定 megabytes 為單位;
統計開始時間問題:默認iostat和vmstat相似,默認第一次/行都是從開機到目前的一個數據,可以使用 -y 選項去掉第一次/行的數據;
CPU與磁盤: iostat 默認會顯示cpu和磁盤的數據,如果只要cpu數據可以使用 -c 選項,如果只需要磁盤數據,可以使用 -d 選項;
時間間隔和重復次數:[interval [times]] 表示磁盤統計數據的間隔時間和次數;
-x : 該選項顯示具體的擴展信息;
可以看到IO操作分成了四個層面:
1)文件系統緩存:處理數據必須先從磁盤讀到緩存,然後修改,然後刷會磁盤。緩存的刷新涉及到兩個參數:vm.dirty_background_ratio、vm.dirty_ratio。還有刷新寫回時,使用到 bio 結構,bio的組成是由磁盤上相鄰的block組成的,所以這裡進行了優化。
2)block layer:該層就涉及到 IO調度算法,IO調度算法在mysql服務器是一個很重要的調優手段。系統中所有進程申請的IO操作,全部在這裡進行排隊,等待調度,然後寫回磁盤。調度算法有四種:
1> Anticipatory: 適用於個人PC,單磁盤系統;
2> CFQ(Complete Fair Queuing):默認的IO調度算法,完全公平的排隊調度算法。每一個進程的IO請求會安排進一個專門的IO隊列,然後按照進程組來公平的調度IO,也就是每一個進程組之間按照公平的方式來調度IO。顯然他適合多用戶的系統,但是極為不適合作為數據庫系統的IO調度算法,因為顯而易見,數據庫系統中,數據庫進程肯定是IO最多的一個進程組,然後它卻只能獲得和其它進程一樣多的IO調度機會。所以顯然這是極為不合理的。數據庫系統絕對不要使用該調度算法。
3> Deadline: 按照截止期限來循環在各個IO隊列中進行調度,所以它提供了一個近實時的IO系統,並且磁盤throughput也很好,也不會造成starvation.一般mysql系統建議采用該調度算法。
4> NOOP: 簡單的FIFO隊列進行調度,No operation的意思是,它沒有進行額外的將臨近的IO進行合並的操作,所以它對CPU的使用極少。該調度算法特別適合於SSD。因為SSD在對待順序IO和隨機IO沒有什麼區別。所以它不需要對臨近的IO進行合並。避免了合並操作對CPU的使用。
所以一般而言,對於mysql的系統,如果是SSD,那麼應該使用NOOP調度算法,如果是磁盤,就應該使用Deadline調度算法。
查看與修改IO調度算法:
臨時修改:
[root@localhost ~]# cat /sys/block/sda/queue/scheduler
noop anticipatory deadline [cfq]
[root@localhost ~]# echo noop > /sys/block/sda/queue/scheduler
[root@localhost ~]# cat /sys/block/sda/queue/scheduler
[noop] anticipatory deadline cfq
永久修改:
# vi /boot/grub/menu.lst
更改到如下內容:
kernel /boot/vmlinuz-2.6.18-8.el5 ro root=LABEL=/ elevator=deadline rhgb quiet
重啟之後,查看調度方法:
# cat /sys/block/sda/queue/scheduler
noop anticipatory [deadline] cfq
已經是deadline了
3)磁盤驅動層:對於順序讀系統而言,很容易在磁盤接口層的帶寬上成為瓶頸所在;
4)磁盤:對於隨機讀多的系統而言,磁盤很容易成為瓶頸所在,一般的優化就是使用RAID或者換SSD;
2. IO瓶頸檢測
2.1 使用 iostat 查看磁盤IO
顯示單位問題:默認iostat是以磁盤的block為單位,也可以使用 -k 來指定以 kilobytes 為單位,或者使用 -m 指定 megabytes 為單位;
統計開始時間問題:默認iostat和vmstat相似,默認第一次/行都是從開機到目前的一個數據,可以使用 -y 選項去掉第一次/行的數據;
CPU與磁盤: iostat 默認會顯示cpu和磁盤的數據,如果只要cpu數據可以使用 -c 選項,如果只需要磁盤數據,可以使用 -d 選項;
時間間隔和重復次數:[interval [times]] 表示磁盤統計數據的間隔時間和次數;
-x : 該選項顯示具體的擴展信息;
[root@localhost ~]# iostat
Linux 2.6.32-504.el6.i686 (localhost.localdomain)       10/09/2015      _i686_  (1 CPU)

avg-cpu:  %user   %nice %system %iowait  %steal   %idle
           0.60    0.00    7.80    0.31    0.00   91.30

Device:            tps   Blk_read/s   Blk_wrtn/s   Blk_read   Blk_wrtn
scd0              0.02         0.21         0.00        536          0
sda               2.00        78.60         8.43     198702      21312[root@localhost ~]# iostat -c
Linux 2.6.32-504.el6.i686 (localhost.localdomain)       10/09/2015      _i686_  (1 CPU)

avg-cpu:  %user   %nice %system %iowait  %steal   %idle
           0.48    0.00    6.51    0.25    0.00   92.76
[root@localhost ~]# iostat -d -k
Linux 2.6.32-504.el6.i686 (localhost.localdomain)       10/09/2015      _i686_  (1 CPU)

Device:            tps    kB_read/s    kB_wrtn/s    kB_read    kB_wrtn
scd0              0.02         0.08         0.00        268          0
sda               1.69        31.17         4.15      99363      13224

[root@localhost ~]# iostat -d -m
Linux 2.6.32-504.el6.i686 (localhost.localdomain)       10/09/2015      _i686_  (1 CPU)

Device:            tps    MB_read/s    MB_wrtn/s    MB_read    MB_wrtn
scd0              0.02         0.00         0.00          0          0
sda               1.69         0.03         0.00         97         12

[root@localhost ~]# iostat -d -m -x
Linux 2.6.32-504.el6.i686 (localhost.localdomain)       10/09/2015      _i686_  (1 CPU)

Device:         rrqm/s   wrqm/s     r/s     w/s    rMB/s    wMB/s avgrq-sz avgqu-sz   await  svctm  %util
scd0              0.02     0.00    0.02    0.00     0.00     0.00    10.94     0.00    4.96   4.88   0.01
sda               1.22     0.48    1.13    0.56     0.03     0.00    41.66     0.01    6.83   5.27   0.89

[root@localhost ~]# iostat -d -m -x 2 3
Linux 2.6.32-504.el6.i686 (localhost.localdomain)       10/09/2015      _i686_  (1 CPU)

Device:         rrqm/s   wrqm/s     r/s     w/s    rMB/s    wMB/s avgrq-sz avgqu-sz   await  svctm  %util
scd0              0.02     0.00    0.01    0.00     0.00     0.00    10.94     0.00    4.96   4.88   0.01
sda               1.19     0.48    1.10    0.55     0.03     0.00    41.52     0.01    6.81   5.25   0.87

Device:         rrqm/s   wrqm/s     r/s     w/s    rMB/s    wMB/s avgrq-sz avgqu-sz   await  svctm  %util
scd0              0.00     0.00    0.00    0.00     0.00     0.00     0.00     0.00    0.00   0.00   0.00
sda               0.00     0.00    0.00    0.00     0.00     0.00     0.00     0.00    0.00   0.00   0.00

Device:         rrqm/s   wrqm/s     r/s     w/s    rMB/s    wMB/s avgrq-sz avgqu-sz   await  svctm  %util
scd0              0.00     0.00    0.00    0.00     0.00     0.00     0.00     0.00    0.00   0.00   0.00
sda               0.00     0.00    0.00    0.51     0.00     0.00     8.00     0.00    3.00   3.00   0.15

[root@localhost ~]# iostat -y -d -m -x 2 3
Linux 2.6.32-504.el6.i686 (localhost.localdomain)       10/09/2015      _i686_  (1 CPU)

Device:         rrqm/s   wrqm/s     r/s     w/s    rMB/s    wMB/s avgrq-sz avgqu-sz   await  svctm  %util
scd0              0.00     0.00    0.00    0.00     0.00     0.00     0.00     0.00    0.00   0.00   0.00
sda               0.00     0.00    0.00    0.00     0.00     0.00     0.00     0.00    0.00   0.00   0.00

Device:         rrqm/s   wrqm/s     r/s     w/s    rMB/s    wMB/s avgrq-sz avgqu-sz   await  svctm  %util
scd0              0.00     0.00    0.00    0.00     0.00     0.00     0.00     0.00    0.00   0.00   0.00
sda               0.00     0.00    0.00    0.00     0.00     0.00     0.00     0.00    0.00   0.00   0.00
字段含義: Blk_read/s Blk_wrtn/s Blk_read Blk_wrtn 分別表示:每秒讀取block的個數,每秒寫block的個數,總共讀了多少個block,總共寫了多少個block tps: Indicate the number of transfers per second that were issued to the device. A transfer is an I/O request to the device. Multiple logical requests can be combined into a single I/O request to the device. A transfer is of indeterminate size.(就是對磁盤每秒請求多少次IO操作) rrqm/s wrqm/s r/s w/s rMB/s wMB/s avgrq-sz avgqu-sz await svctm %util rrqm/s wrqm/s 表示的磁盤讀和寫時每秒發生多少次相鄰磁盤的merge操作;rrqm: read request merge; wrqm:write request merge r/s w/s 表示每秒讀的次數,寫的次數; rMB/s wMB/s 表示每秒讀多少MB,寫多少MB avgrq-sz:The average size (in sectors) of the requests that were issued to the device. 平均一個IO請求涉及到多少個sector avgqu-sz:The average queue length of the requests that were issued to the device. IO隊列的平均長度,該數值很重要。 await:The average time (in milliseconds) for I/O requests issued to the device to be served. This includes the time spent by the requests in queue and the time spent servicing them.平均每一個IO花費了多少毫秒(包括在IO隊列中的排隊時間和讀寫操作花費的時間)。這裡可以理解為IO的響應時間,一般地系統IO響應時間應該低於5ms,如果大於10ms就比較大了。 svctm:棄用 %util :Percentage of CPU time during which I/O requests were issued to the device (bandwidth utilization for the device). Device saturation occurs when this value is close to 100%. 在統計時間內所有處理IO時間,除以總共統計時間。例如,如果統計間隔1秒,該設備有0.8秒在處理IO,而0.2秒閒置,那麼該設備 的%util = 0.8/1 = 80%,所以該參數暗示了設備的繁忙程度。一般地,如果該參數是100%表示設備已經接近滿負荷運行了(當然如果是多磁盤,即使%util是100%,因 為磁盤的並發能力,所以磁盤使用未必就到了瓶頸)。 CPU的 %iowait io等待很高; 磁盤的 avgqu-sz數值很大;await數值很高;%util數值很高;都可能預示著磁盤存在瓶頸或者磁盤出現問題或者故障。 2.2 使用 iostat 查看磁盤每個分區的IO 上面查看的都是整個磁盤的IO情況,下面的命令可以查看具體某個磁盤的所有分區的IO情況:
[root@localhost ~]# iostat -x -d -m -p sda 2 3
Linux 2.6.32-504.el6.i686 (localhost.localdomain)       10/09/2015      _i686_  (1 CPU)

Device:         rrqm/s   wrqm/s     r/s     w/s    rMB/s    wMB/s avgrq-sz avgqu-sz   await  svctm  %util
sda               0.82     0.43    0.76    0.52     0.02     0.00    38.49     0.01    6.27   4.82   0.62
sda1              0.80     0.42    0.53    0.51     0.02     0.00    45.09     0.01    6.92   5.50   0.57
sda2              0.01     0.02    0.12    0.01     0.00     0.00     9.70     0.00    2.95   2.79   0.04
sda3              0.01     0.00    0.07    0.00     0.00     0.00     8.67     0.00    3.72   3.65   0.03

Device:         rrqm/s   wrqm/s     r/s     w/s    rMB/s    wMB/s avgrq-sz avgqu-sz   await  svctm  %util
sda               0.00     0.00    0.00    0.00     0.00     0.00     0.00     0.00    0.00   0.00   0.00
sda1              0.00     0.00    0.00    0.00     0.00     0.00     0.00     0.00    0.00   0.00   0.00
sda2              0.00     0.00    0.00    0.00     0.00     0.00     0.00     0.00    0.00   0.00   0.00
sda3              0.00     0.00    0.00    0.00     0.00     0.00     0.00     0.00    0.00   0.00   0.00

[root@localhost ~]# iostat -d -m -p sda 2 3
Linux 2.6.32-504.el6.i686 (localhost.localdomain)       10/09/2015      _i686_  (1 CPU)

Device:            tps    MB_read/s    MB_wrtn/s    MB_read    MB_wrtn
sda               1.25         0.02         0.00         97         18
sda1              1.02         0.02         0.00         92         17
sda2              0.13         0.00         0.00          2          0
sda3              0.07         0.00         0.00          1          0

Device:            tps    MB_read/s    MB_wrtn/s    MB_read    MB_wrtn
sda               0.00         0.00         0.00          0          0
sda1              0.00         0.00         0.00          0          0
sda2              0.00         0.00         0.00          0          0
sda3              0.00         0.00         0.00          0          0
2.3 使用 vmstat 查看磁盤IO
[root@localhost ~]# vmstat 2 4
procs -----------memory---------- ---swap-- -----io---- --system-- -----cpu-----
 r  b   swpd   free   buff  cache   si   so    bi    bo   in   cs us sy id wa st
 0  0      0 454900  21808  76776    0    0    20     4   97   81  0  5 95  0  0
 0  0      0 454892  21808  76772    0    0     0     8   83  106  0  3 97  0  0
 1  0      0 454760  21816  76772    0    0     0    44  101  153  1  5 94  0  0
 0  0      0 454760  21816  76784    0    0     0     0   57   68  0  1 99  0  0
bi: Blocks received from a block device (blocks/s). 每秒讀取多少個block到內存 bo: Blocks sent to a block device (blocks/s). 每秒內存寫出多少個block到磁盤 2.4 使用 sar -b 查看磁盤IO
[root@localhost ~]# sar -b 2 4
Linux 2.6.32-504.el6.i686 (localhost.localdomain)       10/09/2015      _i686_  (1 CPU)

03:53:21 PM       tps      rtps      wtps   bread/s   bwrtn/s
03:53:23 PM      0.00      0.00      0.00      0.00      0.00
03:53:25 PM      0.00      0.00      0.00      0.00      0.00
03:53:27 PM      0.00      0.00      0.00      0.00      0.00
03:53:29 PM      0.00      0.00      0.00      0.00      0.00
Average:         0.00      0.00      0.00      0.00      0.00
tps: 上面有介紹;rtps: 表示讀的tps;wtps: 表示寫的tps; bread/s: 每秒讀多少個block;bwrtn/s: 每秒寫多少個block; 2.5 使用 iotop 找到IO最多的進程/線程 iotop類似於top命令,默認按照IO排序: iotop :
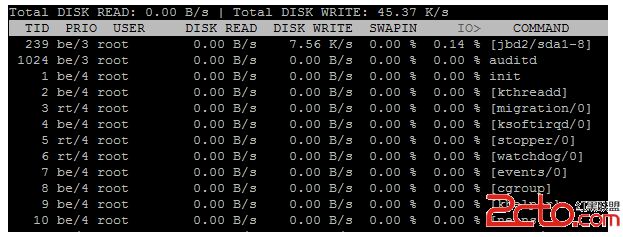 iotop 是可以交互的:
Use the left and right arrows to change the sorting, r to reverse the sorting order, o to toggle the --only
option, p to toggle the --processes option, a to toggle the --accumulated option, q to quit or i to change the
priority of a thread or a process’ thread(s). Any other key will force a refresh.
1)利用左右鍵 可以選擇排序的字段,默認按照IO>倒序,可以按照SWAPIN,DISK WRITE 等等字段排序,使用左右方向鍵即可;
2)利用 p鍵 可以在按照 進程顯示 和按照 線程顯示之間切換;
3)r 鍵可以改變排序的方向:倒序 和 順序
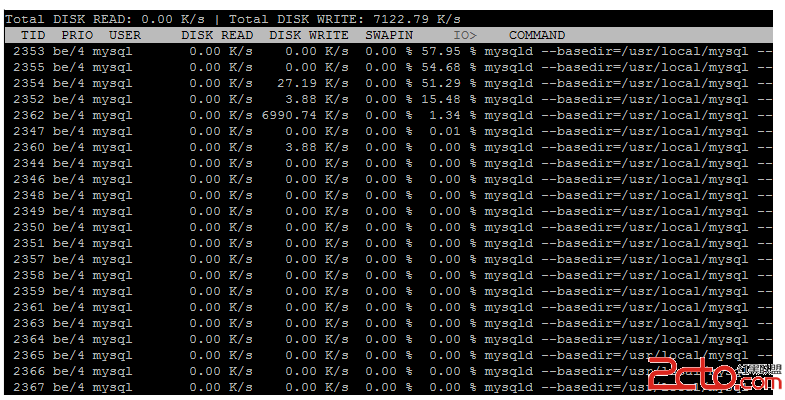
查看mysqld的IO:
iotop -k -u mysql (-k 表示KB,-u mysql表示顯示mysql用戶的所有進程的IO):
iotop 是可以交互的:
Use the left and right arrows to change the sorting, r to reverse the sorting order, o to toggle the --only
option, p to toggle the --processes option, a to toggle the --accumulated option, q to quit or i to change the
priority of a thread or a process’ thread(s). Any other key will force a refresh.
1)利用左右鍵 可以選擇排序的字段,默認按照IO>倒序,可以按照SWAPIN,DISK WRITE 等等字段排序,使用左右方向鍵即可;
2)利用 p鍵 可以在按照 進程顯示 和按照 線程顯示之間切換;
3)r 鍵可以改變排序的方向:倒序 和 順序
查看mysqld的IO:
iotop -k -u mysql (-k 表示KB,-u mysql表示顯示mysql用戶的所有進程的IO):
 3. 實例分析
$$iostat -d -k 1 |grep sda10
Device:            tps    kB_read/s    kB_wrtn/s    kB_read    kB_wrtn
sda10            60.72        18.95        71.53  395637647 1493241908
sda10           299.02      4266.67       129.41       4352        132
sda10           483.84      4589.90      4117.17       4544       4076
sda10           218.00      3360.00       100.00       3360        100
sda10           546.00      8784.00       124.00       8784        124
sda10           827.00     13232.00       136.00      13232        136
上面看到,磁盤每秒傳輸次數平均約400;每秒磁盤讀取約5MB,寫入約1MB。 iostat -d -x -k 1 Device: rrqm/s wrqm/s r/s w/s rsec/s wsec/s rkB/s wkB/s avgrq-sz avgqu-sz await svctm %util sda 1.56 28.31 7.84 31.50 43.65 3.16 21.82 1.58 1.19 0.03 0.80 2.61 10.29 sda 1.98 24.75 419.80 6.93 13465.35 253.47 6732.67 126.73 32.15 2.00 4.70 2.00 85.25 sda 3.06 41.84 444.90 54.08 14204.08 2048.98 7102.04 1024.49 32.57 2.10 4.21 1.85 92.24 可以看到磁盤的平均響應時間<5ms,磁盤使用率>80。磁盤響應正常,但是已經很繁忙了。 4. 磁盤IO優化 磁盤IO在優化之前,首先要弄清楚系統的IO情況,是隨機IO多,還是順序IO多,是大文件IO多,還是小文件IO多(小文件IO一般也就是隨機IO)。比如隨機IO多,那麼就可以通過加磁盤使用RAID技術來優化,如果是順序IO遇到瓶頸,一般可能是磁盤驅動的帶寬有瓶頸,就可以換一個更快的disk controller。搞清楚是磁盤有瓶頸,還是磁盤驅動的帶寬有瓶頸。 因為磁盤IO的操作分成了4個層面,所以IO的優化也可以從這四個方面入手: 1)正對mysql系統的調優,還需要選擇正確的IO調度算法,如果是SSD,選擇NOOP調度算法,如果是磁盤,那麼選擇deadline調度算法; 2)針對mysql還顯然可以通過maser-slave來讀寫分離進行磁盤IO優化。 3)另外增大內存,可以對更多的磁盤文件進行緩存,也能減輕IO壓力。 4)還有文件系統的掛載選項 noatime, nodiratime也能減輕IO壓力,另外選擇正確的文件系統也能提高磁盤的tps. mysql數據庫推薦使用XFS文件系統。 注:上面顯示的磁盤IO的數據,很多都是0,這是因為數據來自於虛擬機中的Linux系統。