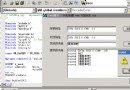
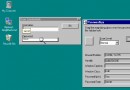
程序運行效果圖
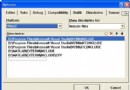
一、在工程中加入 mschart
菜單->Project->Add To Project->Components and Controls- >Registered ActiveX Controls->Microsoft Chart Control, version 6.0 (OLEDB)
二、在CDemoView中加入:CMSChart m_Chart
三、創建及設置m_Chart
3.1 在 CDemoView::OnCreate 中創建CMSChart
// CDemoView::OnCreate()3.2 在 CDemoView::OnSize 中調整 m_Chart 的大小,使之 能隨窗口大小變化而變化
CRect rc;
GetClientRect(&rc);
if(!m_Chart.Create("mschart", WS_CHILD| WS_VISIBLE, rc, this, 10))
return -1;// CDemoView::OnSize
if( m_Chart.GetSafeHwnd() )
m_Chart.MoveWindow( 0, 0, cx, cy );
3.3 設置 m_Chart
void CDemoView::InitChart()

{

  // 設置標題

  m_Chart.SetTitleText("mschart 示例 by thinkry@263.net");

  // 下面兩句改變背景色

  m_Chart.GetBackdrop().GetFill().SetStyle(1);

  m_Chart.GetBackdrop().GetFill().GetBrush().GetFillColor().Set(255, 255, 255);

  // 顯示圖例

  m_Chart.SetShowLegend(TRUE);

  m_Chart.SetColumn(1);

  m_Chart.SetColumnLabel((LPCTSTR)"1號機");

  m_Chart.SetColumn(2);

  m_Chart.SetColumnLabel((LPCTSTR)"2號機");

  m_Chart.SetColumn(3);

  m_Chart.SetColumnLabel((LPCTSTR)"3號機");

  // 棧模式

  // m_Chart.SetStacking(TRUE);

  // Y軸設置

  VARIANT var;

  m_Chart.GetPlot().GetAxis(1,var).GetValueScale().SetAuto(FALSE); // 不自動標注Y軸刻度

  m_Chart.GetPlot().GetAxis(1,var).GetValueScale().SetMaximum(100); // Y軸最大刻度

  m_Chart.GetPlot().GetAxis(1,var).GetValueScale().SetMinimum(0); // Y軸最小刻度

  m_Chart.GetPlot().GetAxis(1,var).GetValueScale().SetMajorDivision (5); // Y軸刻度5等分

  m_Chart.GetPlot().GetAxis(1,var).GetValueScale().SetMinorDivision (1); // 每刻度一個刻度線

  m_Chart.GetPlot().GetAxis(1,var).GetAxisTitle().SetText("小時 "); // Y軸名稱

  // 3條曲線

  m_Chart.SetColumnCount(3);

  // 線色

  m_Chart.GetPlot().GetSeriesCollection().GetItem(1).GetPen ().GetVtColor().Set(0, 0, 255);

  m_Chart.GetPlot().GetSeriesCollection().GetItem(2).GetPen ().GetVtColor().Set(255, 0, 0);

  m_Chart.GetPlot().GetSeriesCollection().GetItem(3).GetPen ().GetVtColor().Set(0, 255, 0);

  // 線寬(對點線圖有效)

  m_Chart.GetPlot().GetSeriesCollection().GetItem(1).GetPen ().SetWidth(50);

  m_Chart.GetPlot().GetSeriesCollection().GetItem(2).GetPen ().SetWidth(100);

  m_Chart.GetPlot().GetSeriesCollection().GetItem(3).GetPen ().SetWidth(2);

  // 數據點類型顯示數據值的模式(對柱柱狀圖和點線圖有效)

  // 0: 不顯示 1: 顯示在柱狀圖外

  // 2: 顯示在柱狀圖內上方 3: 顯示在柱狀圖內中間 4: 顯示在柱狀圖內下 方

  m_Chart.GetPlot().GetSeriesCollection().GetItem(1).GetDataPoints ().GetItem(-1).GetDataPointLabel().SetLocationType(1);

  m_Chart.GetPlot().GetSeriesCollection().GetItem(2).GetDataPoints ().GetItem(-1).GetDataPointLabel().SetLocationType(1);

  m_Chart.GetPlot().GetSeriesCollection().GetItem(3).GetDataPoints ().GetItem(-1).GetDataPointLabel().SetLocationType(1);

}
3.4 設置數據
void CDemoView::DrawChart()

{

  int nRowCount = 6;

  m_Chart.SetRowCount(nRowCount);

  VARIANT var;


  // 不自動標注X軸刻度

  m_Chart.GetPlot().GetAxis(0,var).GetCategoryScale().SetAuto (FALSE);


  // 每刻度一個標注

  m_Chart.GetPlot().GetAxis(0,var).GetCategoryScale ().SetDivisionsPerLabel(1);


  // 每刻度一個刻度線

  m_Chart.GetPlot().GetAxis(0,var).GetCategoryScale ().SetDivisionsPerTick(1);


  // X軸名稱

  m_Chart.GetPlot().GetAxis(0,var).GetAxisTitle().SetText("日期 ");

  char buf[32];

  srand( (unsigned)time( NULL ) );

  for(int row = 1; row <= nRowCount; ++row)

  {

    m_Chart.SetRow(row);

    sprintf(buf, "%d號", row);

    m_Chart.SetRowLabel((LPCTSTR)buf);

    m_Chart.GetDataGrid().SetData(row, 1, rand() * 100 / RAND_MAX, 0);

    m_Chart.GetDataGrid().SetData(row, 2, rand() * 100 / RAND_MAX, 0);

    m_Chart.GetDataGrid().SetData(row, 3, rand() * 100 / RAND_MAX, 0);

  }

  m_Chart.Refresh();

}
3.5 改變顯示類型
// 折線圖

void CDemoView::OnChartLine()

{

  m_Chart.SetChartType(3);

  DrawChart();

}

// 柱狀圖

void CDemoView::OnChartCombi()

{

  m_Chart.SetChartType(1);

  DrawChart();

}

// 餅狀圖

void CDemoView::OnChartPie()

{

  m_Chart.SetChartType(14);

  DrawChart();

}
本文配套源碼