一 在頁面中先添加一個chart控件,不用做什麼設置,把自動生成的那個series刪除掉,只設置其大小和ID就可以了,其它的在代碼中進行設置.
二 所綁定的數據是根據所選條件的不同查詢數據後進行動態綁定的,www.2cto.com 以前認為這個比較復雜,原來也是很簡單的,對數據進行表綁定和交叉表綁定很實用.getdata是一個自己寫的函數,用於根據所填寫的sql語句返回相應的數據集
三 關於tooltip的提示信息的綁定,這個目前為止還沒有找到如何對其數據進行運算的方法,如果哪位找到了請留言,代碼比較亂,大家湊和地看吧.
下面是代碼:
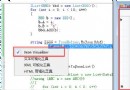
Select Case lx
Case "銷售台次"
sql = "select month(日期) as 月份,月台次 from 產值_銷售 where year(日期)='" & year & "' and day(dateadd(""d"",1,日期))='1' and 所在店='" & szd & "' order by 日期"
CH_xs.DataBindTable(hr.GetData(sql), "月份")
CH_xs.Series(0).Label = "#VAL"
ch_xs1.DataBindTable(hr.GetData(sql), "月份")
ch_xs1.Series(0).Label = "#VAL"
Case ("售後產值")
sql = "select month(日期) as 月份,售後月產值 as 月產值 from 產值_售後 where year(日期)='" & year & "' and day(dateadd(""d"",1,日期))='1' and 所在店='" & szd & "' order by 日期"
CH_xs.DataBindTable(hr.GetData(sql), "月份")
ch_xs1.DataBindTable(hr.GetData(sql), "月份")
CH_xs.Series(0).Label = "#VAL"
CH_xs.Series(0).ToolTip = "本月產值:#VAL"
ch_xs1.Series(0).Label = "#VAL"
Case ("集團產值")
sql = "select month(日期) as 月份,所在店,(售後月產值/10000) as 月產值 from 產值_售後 where year(日期)='" & year & "' and day(dateadd(""d"",1,日期))='1' order by 日期"
CH_xs.DataBindCrossTable(hr.GetData(sql), "所在店", "月份", "月產值", "Label=月產值{C}")
ch_xs1.DataBindCrossTable(hr.GetData(sql), "所在店", "月份", "月產值", "Label=月產值{C}")
CH_xs.Series(0).Label = "#VAL"
'CH_xs.Series(0).ToolTip = "本月產值:#VAL"
ch_xs1.Series(0).Label = "#VAL"
CH_xs.Width = "1200"
ch_xs1.Width = "1200"
Case ("集團台次")
sql = "select month(日期) as 月份,所在店,月台次 from 產值_銷售 where year(日期)='" & year & "' and day(dateadd(""d"",1,日期))='1' order by 日期"
CH_xs.DataBindCrossTable(hr.GetData(sql), "所在店", "月份", "月台次", "Label=月台次")
ch_xs1.DataBindCrossTable(hr.GetData(sql), "所在店", "月份", "月台次", "Label=月台次")
CH_xs.Series(0).Label = "#VAL"
'CH_xs.Series(0).ToolTip = "本月產值:#VAL"
ch_xs1.Series(0).Label = "#VAL"
CH_xs.Width = "1200"
ch_xs1.Width = "1200"
End Select
Dim i As Integer
For i = 0 To ch_xs1.Series.Count - 1
ch_xs1.Series(i).ChartType = DataVisualization.Charting.SeriesChartType.Line
ch_xs1.Series(i).MarkerStyle = DataVisualization.Charting.MarkerStyle.Circle
ch_xs1.Series(i).MarkerSize = 8
ch_xs1.Series(i).BorderWidth = "3"
ch_xs1.Series(i).ShadowColor = Drawing.Color.Black
ch_xs1.Series(i).BorderColor = Drawing.Color.Aqua
ch_xs1.Series(i).ShadowOffset = 2
ch_xs1.Series(i).YValueType = DataVisualization.Charting.ChartValueType.Double
ch_xs1.Series(i).XValueType = DataVisualization.Charting.ChartValueType.Double
Next
CH_xs.ChartAreas(0).Area3DStyle.IsClustered = True
CH_xs.ChartAreas(0).Area3DStyle.Enable3D = True
CH_xs.ChartAreas(0).Area3DStyle.LightStyle = DataVisualization.Charting.LightStyle.Realistic
For i = 0 To CH_xs.Series.Count - 1
CH_xs.Series(i).ChartType = DataVisualization.Charting.SeriesChartType.Column
CH_xs.Series(i).MarkerStyle = DataVisualization.Charting.MarkerStyle.None
CH_xs.Series(i).ShadowColor = Drawing.Color.Black
CH_xs.Series(i).ShadowOffset = 2
Next