HorizontalBarSampleDemo.cs和StackedBarSampleDemo.cs介紹
第六、七節HorizontalBarSampleDemo.cs和StackedBarSampleDemo.cs介紹
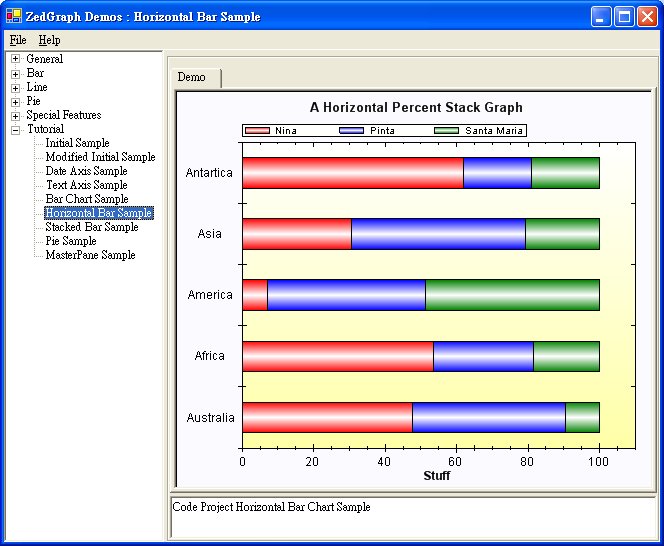
這兩節與第五節相比,並沒有本質上的區別,所以這裡只給出相應的代碼、示例圖和必要的說明。
using System;


using System.Drawing;


using System.Collections;


using ZedGraph;


namespace ZedGraph.Demo


{


     ///<summary>


     /// Summary description for SimpleDemo.


     ///</summary>


     public class HorizontalBarSampleDemo : DemoBase


     {


           public HorizontalBarSampleDemo() : base( "Code Project Horizontal Bar Chart Sample",


                "Horizontal Bar Sample", DemoType.Tutorial )


           {


                GraphPane myPane = base.GraphPane;


                // Set the title and axis labels


                myPane.Title = "A Horizontal Percent Stack Graph";


                myPane.XAxis.Title = "Stuff";


                myPane.YAxis.Title = "";


                // Enter some random data values


                double[] y = { 100, 115, 15, 22, 98 };


                double[] y2 = { 90, 60, 95, 35, 30 };


                double[] y3 = { 20, 40, 105, 15, 30 };


                // Generate a red bar with "Nina" in the legend


                BarItem myCurve = myPane.AddBar( "Nina", y, null, Color.Red );


                myCurve.Bar.Fill = new Fill( Color.Red, Color.White, Color.Red, 90F );


                // Generate a blue bar with "Pinta" in the legend


                myCurve = myPane.AddBar( "Pinta", y2, null, Color.Blue );


                myCurve.Bar.Fill = new Fill( Color.Blue, Color.White, Color.Blue, 90F );


                // Generate a green bar with "Santa Maria" in the legend


                myCurve = myPane.AddBar( "Santa Maria", y3, null, Color.Green );


                myCurve.Bar.Fill = new Fill( Color.Green, Color.White, Color.Green, 90F );


                // Draw the Y tics between the labels instead of at the labels


                myPane.YAxis.IsTicsBetweenLabels = true;


                // Set the YAxis to text type


                myPane.YAxis.Type = AxisType.Text;


                string[] labels = { "Australia", "Africa", "America", "Asia", "Antartica" };


                myPane.YAxis.TextLabels = labels;


                myPane.XAxis.Max = 110;


                // Make the bars horizontal by setting bar base axis to Y


                myPane.BarBase = BarBase.Y;


                // Make the bars percent stack type


                myPane.BarType = BarType.PercentStack;


                // Fill the axis background with a color gradient


                myPane.AxisFill = new Fill( Color.White,


                     Color.FromArgb( 255, 255, 166), 90F );


                // Fill the legend background with a color gradient


                myPane.Legend.Fill = new Fill( Color.White,


                     Color.FromArgb( 255, 255, 250), 90F );


                // Fill the pane background with a solid color


                myPane.PaneFill = new Fill( Color.FromArgb( 250, 250, 255) );


                base.ZedGraphControl.AxisChange();


           }


     }


}
using System;
using System.Drawing;
using System.Collections;
using ZedGraph;
namespace ZedGraph.Demo
{
///<summary>
/// Summary description for SimpleDemo.
///</summary>
public class StackedBarSampleDemo : DemoBase
{
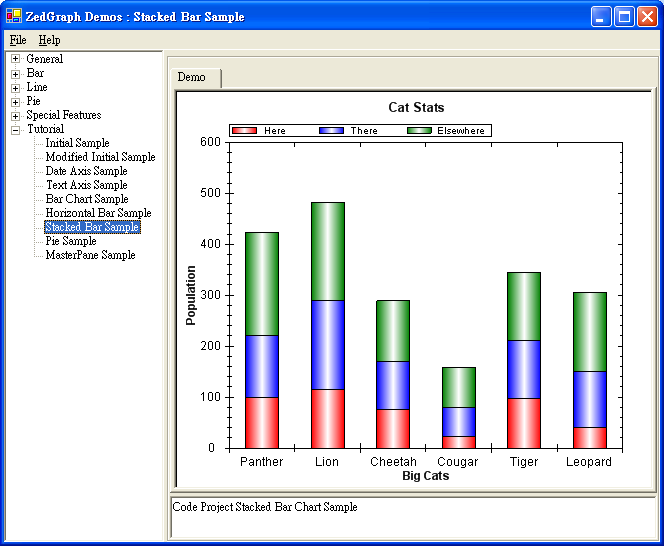
public StackedBarSampleDemo() : base( "Code Project Stacked Bar Chart Sample",
"Stacked Bar Sample", DemoType.Tutorial )
{
GraphPane myPane = base.GraphPane;
// Set the title and axis labels
myPane.Title = "Cat Stats";
myPane.XAxis.Title = "Big Cats";
myPane.YAxis.Title = "Population";
// Make up some data points
string[] labels = { "Panther", "Lion", "Cheetah", "Cougar", "Tiger", "Leopard" };
double[] y = { 100, 115, 75, 22, 98, 40 };
double[] y2 = { 120, 175, 95, 57, 113, 110 };
double[] y3 = { 204, 192, 119, 80, 134, 156 };
// Generate a red bar with "Curve 1" in the legend
BarItem myCurve = myPane.AddBar( "Here", null, y, Color.Red );
// Fill the bar with a red-white-red color gradient for a 3d look
myCurve.Bar.Fill = new Fill( Color.Red, Color.White, Color.Red );
// Generate a blue bar with "Curve 2" in the legend
myCurve = myPane.AddBar( "There", null, y2, Color.Blue );
// Fill the bar with a Blue-white-Blue color gradient for a 3d look
myCurve.Bar.Fill = new Fill( Color.Blue, Color.White, Color.Blue );
// Generate a green bar with "Curve 3" in the legend
myCurve = myPane.AddBar( "Elsewhere", null, y3, Color.Green );
// Fill the bar with a Green-white-Green color gradient for a 3d look
myCurve.Bar.Fill = new Fill( Color.Green, Color.White, Color.Green );
// Draw the X tics between the labels instead of at the labels
myPane.XAxis.IsTicsBetweenLabels = true;
// Set the XAxis labels
myPane.XAxis.TextLabels = labels;
// Set the XAxis to Text type
myPane.XAxis.Type = AxisType.Text;
// Set the bar type to stack, which stacks the bars by automatically accumulating the values
myPane.BarType = BarType.Stack;
base.ZedGraphControl.AxisChange();
}
}
}
這兩個圖的區別就是基軸不同,一個是以X軸為基軸,一個是以Y軸為基軸,ZedGraph中有相應的屬性 ,很方便的在兩個軸之間轉換。如下:
myPane.BarBase = BarBase.Y;
下面我主要說說myPane.BarType。
BarType是一個枚舉,共有六項,分別為Cluster、ClusterHiLow、Overlay、SortedOverlay、Stack和 PercentStack。
Cluster和ClusterHiLow是讓多個同一個基類Bar依次排開,Cluster還可以使用來自IPointList的“Z ”的值來定義每一個Bar的底部。
myPane.BarType = BarType.Cluster;或者myPane.BarType = BarType.ClusterHiLow;如下圖:
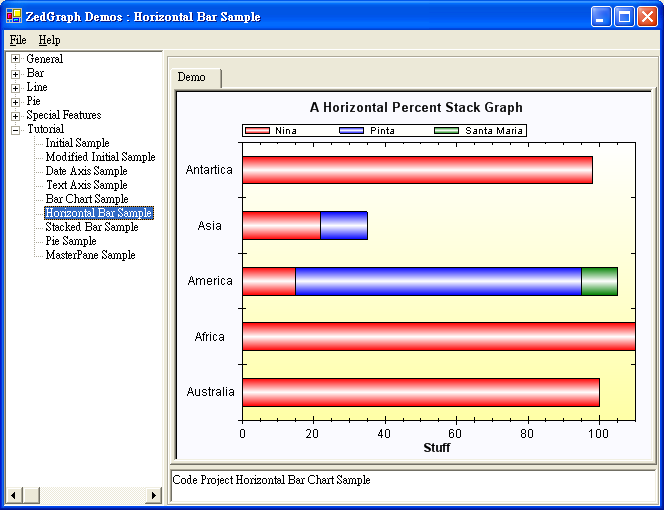
Overlay和SortedOverlay故名思意,就是柱形按坐標相互覆蓋。不同之處在於Overlay是按照哪個先畫 哪個在前的原則(注意這裡不是按後畫把先畫的柱形覆蓋的原則,而是正好相反按先畫在前原則)。
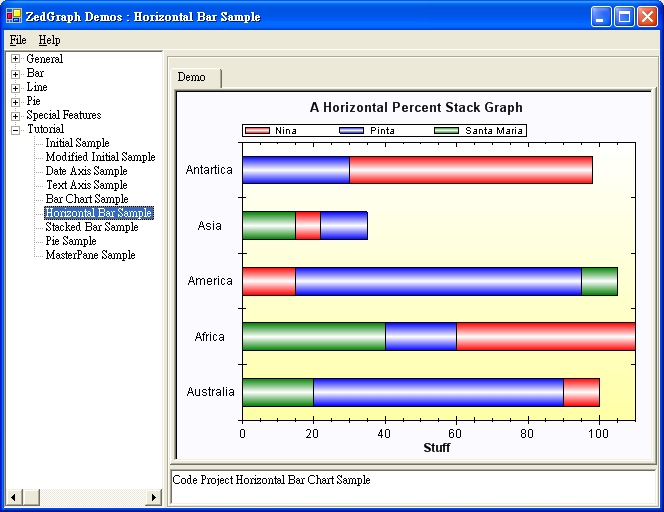
SortedOverlay是按位標的大小,按小的位標在前,大的位標在後的原則來繪圖的。
如下兩圖,第一個是按Overlay,第二個是SortedOverlay。
最後的兩個Stack和PercentStack就是按先前的位標依次累積上升。例如有兩個坐標為( 0 ,100 ), ( 0 , 120),那麼第一個坐標位置就是( 0 , 100 ) , 第二個就是( 100 , 220 )。而PercentStack是把相 應的坐標轉換成百分比來計算坐標位置的。例圖可以參看本節的前兩個圖。