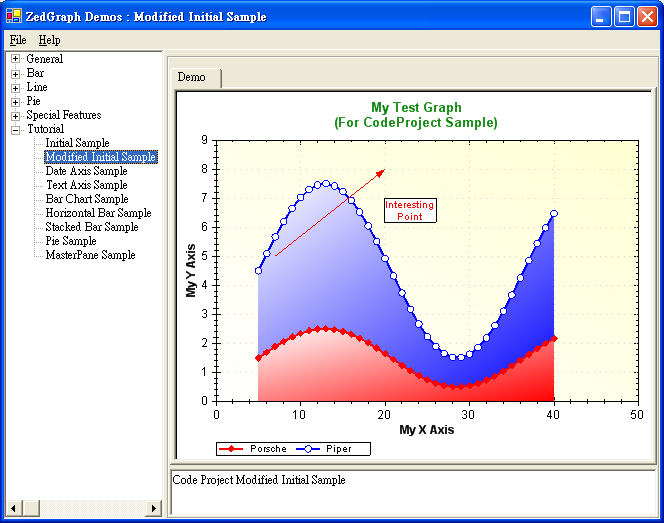
為了講解方便,我先附上源代碼和效果圖。
代碼如下:
using System;


using System.Drawing;


using System.Collections;


using ZedGraph;


namespace ZedGraph.Demo


{


     ///<summary>


     /// Summary description for SimpleDemo.


     ///</summary>


     public class ModInitialSampleDemo : DemoBase


     {


           public ModInitialSampleDemo() : base( "Code Project Modified Initial Sample",


                "Modified Initial Sample", DemoType.Tutorial )


           {


                GraphPane myPane = base.GraphPane;


                // Set up the title and axis labels


                myPane.Title = "My Test Graphn(For CodeProject Sample)";


                myPane.XAxis.Title = "My X Axis";


                myPane.YAxis.Title = "My Y Axis";


                // Make up some data arrays based on the Sine function


                PointPairList list1 = new PointPairList();


                PointPairList list2 = new PointPairList();


                for ( int i=0; i<36; i++ )


                {


                     double x = (double) i + 5;


                     double y1 = 1.5 + Math.Sin( (double) i * 0.2 );


                     double y2 = 3.0 * ( 1.5 + Math.Sin( (double) i * 0.2 ) );


                     list1.Add( x, y1 );


                     list2.Add( x, y2 );


                }


                // Generate a red curve with diamond


                // symbols, and "Porsche" in the legend


                LineItem myCurve = myPane.AddCurve( "Porsche",


                     list1, Color.Red, SymbolType.Diamond );


                // Generate a blue curve with circle


                // symbols, and "Piper" in the legend


                LineItem myCurve2 = myPane.AddCurve( "Piper",


                     list2, Color.Blue, SymbolType.Circle );


                // Change the color of the title


                myPane.FontSpec.FontColor = Color.Green;


                // Add gridlines to the plot, and make them gray


                myPane.XAxis.IsShowGrid = true;


                myPane.YAxis.IsShowGrid = true;


                myPane.XAxis.GridColor = Color.LightGray;


                myPane.YAxis.GridColor = Color.LightGray;


                // Move the legend location


                base.Pane.Legend.Position = ZedGraph.LegendPos.Bottom;


                // Make both curves thicker


                myCurve.Line.Width = 2.0F;


                myCurve2.Line.Width = 2.0F;


                // Fill the area under the curves


                myCurve.Line.Fill = new Fill( Color.White, Color.Red, 45F );


                myCurve2.Line.Fill = new Fill( Color.White, Color.Blue, 45F );


                // Increase the symbol sizes, and fill them with solid white


                myCurve.Symbol.Size = 8.0F;


                myCurve2.Symbol.Size = 8.0F;


                myCurve.Symbol.Fill = new Fill( Color.Red );


                myCurve2.Symbol.Fill = new Fill( Color.White );


                // Add a background gradient fill to the axis frame


                myPane.AxisFill = new Fill( Color.White,


                     Color.FromArgb( 255, 255, 210), -45F );


                // Add a caption and an arrow


                TextItem myText = new TextItem( "InterestingnPoint", 23F, 7F );


                myText.FontSpec.FontColor = Color.Red;


                myText.Location.AlignH = AlignH.Center;


                myText.Location.AlignV = AlignV.Top;


                myPane.GraphItemList.Add( myText );


                ArrowItem myArrow = new ArrowItem( Color.Red, 12F, 7F, 5F, 20F, 8F );


                myPane.GraphItemList.Add( myArrow );


                base.ZedGraphControl.AxisChange();


           }


     }


}
我們可以看到,這個例子和第一節中的例子大部分都相同,我在這只講它們不同的地方,和不好懂的 地方。
和第一節的圖相比,本節的圖在Pane上添加了Grid的顯示,其功能要歸功於如下代碼:
myPane.XAxis.IsShowGrid = true;


myPane.YAxis.IsShowGrid = true;


myPane.XAxis.GridColor = Color.LightGray;


myPane.YAxis.GridColor = Color.LightGray;
代碼一目了然,我就不用多解釋什麼了,要說的是注意在ZedGraph中,很多都是有缺省值的, IsShowGrid的缺省值就是false,所以第一節中沒有對此項進行設置就沒有顯示Grid。
上節我就已經說過
LineItem myCurve = myPane.AddCurve( "Porsche",list1, Color.Red, SymbolType.Diamond );
myCurve接收myPane.AddCurve的返回值後就可以對裡面的線圖作近一步的描述,
myCurve.Line.Width = 2.0F;、myCurve.Line.Fill = new Fill( Color.White, Color.Red, 45F ); 和myCurve.Symbol.Fill = new Fill( Color.Red );
就是其中的三個應用,一個是Line的寬度,第二個表示Line要填充下面的區域,以45度角從左到右從 白到紅的填充,第三個表示線圖上的符號被填充成什麼顏色的。效果見下圖:
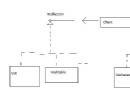
關於Legend的類請見下圖:
base.Pane.Legend.Position = ZedGraph.LegendPos.Bottom;
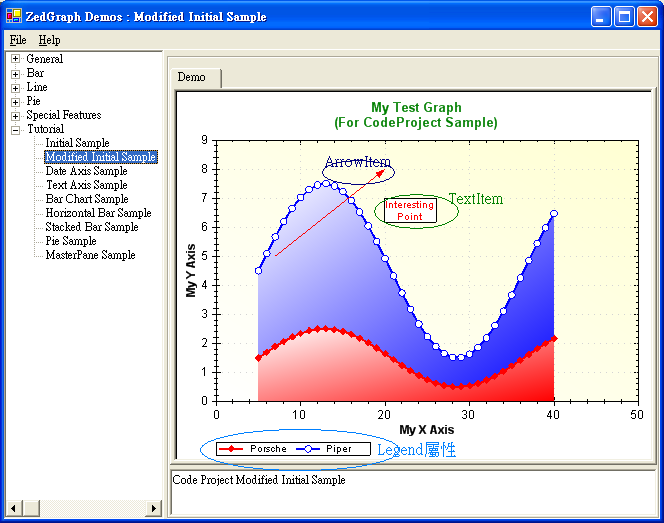
就是顯示Pane中的圖形的名字,它裡面也有很多屬性和方法,如果大家寫上 base.Pane.Legend.IsVisible = false ;那麼就可以隱藏圖形的名字。
TextItem類的主要方法是在Pane中顯示一個textbox的文本框,見上圖
ArrowItem類的主要方法是在Pane上顯示一個箭頭,
ArrowItem myArrow = new ArrowItem( Color.Red, 12F, 7F, 5F, 20F, 8F );
構造函數的參數含義分別為顏色,箭頭的大小,箭頭的起始(x,y),終止(x,y)。