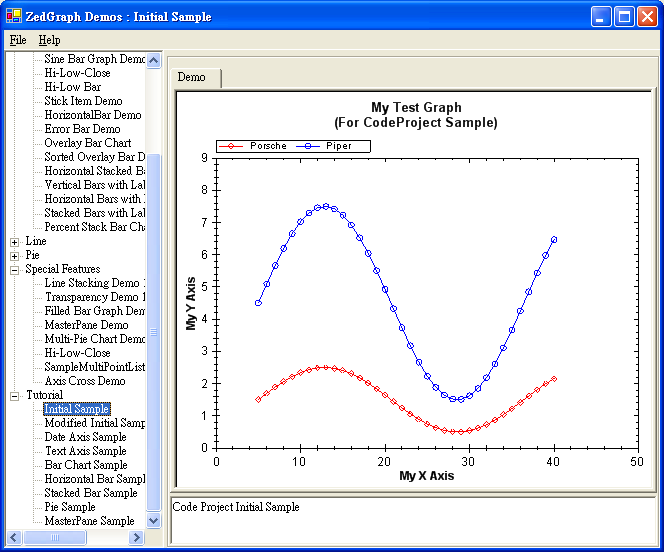
為了講解方便,我先附上源代碼和效果圖。
代碼如下:
using System;


using System.Drawing;


using System.Collections;


using ZedGraph;


namespace ZedGraph.Demo


{


     ///<summary>


     /// Summary description for SimpleDemo.


     ///</summary>


     public class InitialSampleDemo : DemoBase


     {


           public InitialSampleDemo() : base( "Code Project Initial Sample",


                "Initial Sample", DemoType.Tutorial )


           {


                GraphPane myPane = base.GraphPane;


                // Set the title and axis labels


                myPane.Title = "My Test Graphn(For CodeProject Sample)";


                myPane.XAxis.Title = "My X Axis";


                myPane.YAxis.Title = "My Y Axis";


                // Make up some data arrays based on the Sine function


                PointPairList list1 = new PointPairList();


                PointPairList list2 = new PointPairList();


                for ( int i=0; i<36; i++ )


                {


                     double x = (double) i + 5;


                     double y1 = 1.5 + Math.Sin( (double) i * 0.2 );


                     double y2 = 3.0 * ( 1.5 + Math.Sin( (double) i * 0.2 ) );


                     list1.Add( x, y1 );


                     list2.Add( x, y2 );


                }


                // Generate a red curve with diamond


                // symbols, and "Porsche" in the legend


                LineItem myCurve = myPane.AddCurve( "Porsche",


                     list1, Color.Red, SymbolType.Diamond );


                // Generate a blue curve with circle


                // symbols, and "Piper" in the legend


                LineItem myCurve2 = myPane.AddCurve( "Piper",


                     list2, Color.Blue, SymbolType.Circle );


                base.ZedGraphControl.AxisChange();


           }


     }


}
我們可以看到,InitialSampleDemo繼承自CemoBase類,而DemoBase又繼承自ZedGraphDemo這個接口。 ZedGraphDemo接口定義了String Description、String Title、ZedGraph. ZedGraphControl ZedGraphControl 和 System.Collection.ICollection Types這四個屬性。DemoBase除了實現這四個屬性 外,還添加了PaneBase Pane和MasterPane MasterPane這兩個屬性,此外DemoBase還實現了多載構造函數 。關於各個類的具體含義和用法,我會在以後的篇幅中陸續介紹。這裡只是給大家一個整體的大致結構。
下面進行對代碼的分析,由於這是第一個例子,所有我會講得比較細,以後的例子就不會了。
我們可以看到程序首先
public InitialSampleDemo() : base( "Code Project Initial Sample" , "Initial Sample", DemoType.Tutorial )
初始化基類的構造函數。基類重載了四個構造函數
public DemoBase( string description, string title, DemoType type )


           {


                ArrayList types = new ArrayList();


                types.Add( type );


                Init( description, title, types );


           }


           public DemoBase( string description, string title, DemoType type, DemoType type2 )


           {


                ArrayList types = new ArrayList();


                types.Add( type );


                types.Add( type2 );


                Init( description, title, types );


           }


           public DemoBase( string description, string title, ICollection types )


           {


                Init( description, title, types );


           }


           private void Init( string description, string title, ICollection types )


           {


                this.description = description;


                this.title = title;


                this.types = types;


                control = new ZedGraphControl();


           }
函數中的變量含義如下:
Description:對此結構的描述。
Title:在樹形結構(TreeView)中顯示的標題。
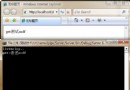
Types:要把此類顯示在哪個樹形結構的區域中。若有多個Types,則把此類分入不同的樹形區域中。例 如MasterPane Sample在Tutorial Sample和 Special Features兩個區域都有。見圖中的相應區域標注。
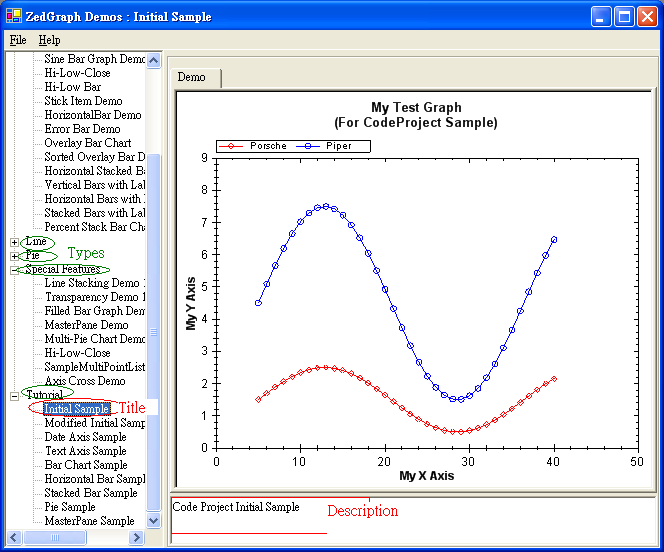
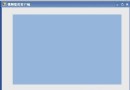
myPane.Title = "My Test Graphn(For CodeProject Sample)";


                myPane.XAxis.Title = "My X Axis";


                myPane.YAxis.Title = "My Y Axis";
分別指定這個Pane的title、XAxis和YAxis的標題。見上圖。
PointPairList list1 = new PointPairList();


                PointPairList list2 = new PointPairList();


                for ( int i=0; i<36; i++ )


                {


                     double x = (double) i + 5;


                     double y1 = 1.5 + Math.Sin( (double) i * 0.2 );


                     double y2 = 3.0 * ( 1.5 + Math.Sin( (double) i * 0.2 ) );


                     list1.Add( x, y1 );


                     list2.Add( x, y2 );


                }
PointPairList類是一個集合類,繼承自
System.Object

                                                                 System.Collections.CollectionBase                                                                          ZedGraph.CollectionPlus
它是PointPair對象的集合,PointPair類是一個包含(X,Y)的坐標類。
其中的for循環在為兩個PointPairList復值。
LineItem myCurve = myPane.AddCurve( "Porsche", list1, Color.Red, SymbolType.Diamond );
LineItem類是ZedGraph中的線條類.
myPane.AddCurve( "Porsche", list1, Color.Red, SymbolType.Diamond );
的意思是將剛剛賦值的list以”Porsche”這個名字以紅色和水晶形狀畫到Pane中,這個函數的返回值 是一個LineItem。你可以通過myCurve這個變量來對它進行進一步的設定。其中SymbolType是個Enum,它 枚舉了12個可供使用的形狀
最後一步就是刷新了。base.ZedGraphControl.AxisChange();
這樣整個程序就完成了,簡單吧,其實這是個簡單的應該,以後會介紹更加復雜的用法和類庫。