以前實現圖表的時候,采用的是OWC,方法如下:
OWC11下載網址
http://www.microsoft.com/downloads/details.ASPx?familyid=7287252C-402E-4F72-97A5-E0FD290D4B76&displaylang=zh-cn
使用教程
http://blog.csdn.Net/Eray/archive/2007/03/20/1534509.ASPx
如果對圖表要求較復雜,最好還是用OWC來實現,而本例是采用一個.vb文件來實現簡單的線、柱、餅狀圖的實現。這個例子的想法來源於另一個例子,利用System.Drawing制作登陸驗證碼,本例是將其擴展之後形成的功能:
http://blog.csdn.Net/Eray/archive/2007/12/14/1937421.ASPx
另外聲明:MSDN中對System.Drawing的警告如下:

不知道MS這是什麼意思,但在寫類,測試中還沒有發現什麼問題。這個問題可能真的如MS所說是意想不到……先不管,實現再說。
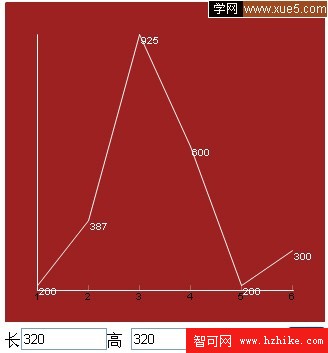
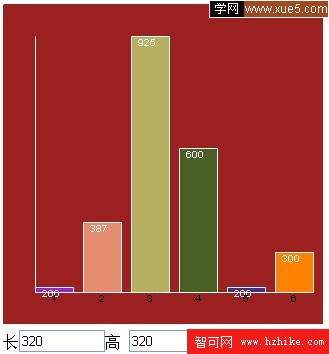
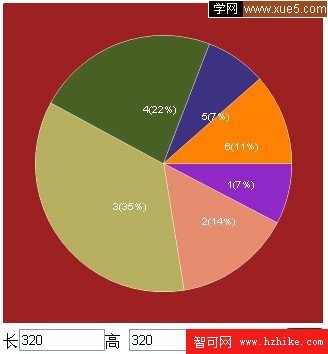
好,言歸正傳,先看截圖(數據為手動添加):
代碼較多,建議下載源碼查看,源碼下載地址
源碼如下:
調用ASPX頁面
<%@ Page Language="VB" AutoEventWireup="false" CodeFile="Default.ASPx.vb" Inherits="_Default" %>
<!DOCTYPE html PUBLIC "-//W3C//DTD XHTML 1.0 Transitional//EN" "http://www.w3.org/TR/xhtml1/DTD/xHtml1-transitional.dtd">
<html XMLns="http://www.w3.org/1999/xHtml" >
<head runat="server">
<title>mainPage</title>
</head>
<body>
<form id="form1" runat="server">
<ASP:Image ID="Image1" runat="server" />
<br />
長<asp:TextBox ID="TextBox1" runat="server" Width="80px">400</ASP:TextBox>高
<asp:TextBox ID="TextBox2" runat="server" Width="72px">300</ASP:TextBox>
<ASP:DropDownList ID="DropDownList1" runat="server">
<asp:ListItem Value="0">線狀圖</ASP:ListItem>
<asp:ListItem Value="1">柱狀圖</ASP:ListItem>
<asp:ListItem Value="2">餅狀圖</ASP:ListItem>
</ASP:DropDownList>
<ASP:Button ID="Button1" runat="server" Text="生成" />
</form>
</body>
</Html>
ASPX.vb
Partial Class _Default
Inherits System.Web.UI.Page
Dim ec As New ErayChart
Protected Sub Button1_Click(ByVal sender As Object, ByVal e As System.EventArgs) Handles Button1.Click
If TextBox1.Text.Trim <> "" And TextBox1.Text.Trim <> "" Then
''手動添加值
Dim lis As New ArrayList
Dim li As ListItem
li = New ListItem
li.Value = "200"
li = New ListItem
li.Value = "387"
li.Text = "2"
lis.Add(li)
li = New ListItem
li.Value = "925"
li.Text = "3"
lis.Add(li)
li = New ListItem
li.Value = "600"
li.Text = "4"
lis.Add(li)
li = New ListItem
li.Value = "200"
li.Text = "5"
lis.Add(li)
li = New ListItem
li.Value = "300"
li.Text = "6"
lis.Add(li)
ec.Width = CInt(TextBox1.Text)
ec.Height = CInt(TextBox2.Text)
ec.Values() = lis
ec.type = DropDownList1.SelectedValue
End If
Image1.ImageUrl = ec.GetImageurl
End Sub
End Class
ErayChart.vb
''-------------------------------------------------------------------------------------------------------------------------
''名稱:ErayChart
''功能:簡單圖表類
''時間:2008年2月1日
''作者:Eray
''歷史:2008年2月1日建類
''-------------------------------------------------------------------------------------------------------------------------
Imports System.IO
Imports system.Drawing
Imports System.Drawing.Imaging
Imports System.Drawing.Drawing2D
Public Class ErayChart
Private gwidth As Integer = 400 ''默認寬
Private gheight As Integer = 300 ''默認高
Private gtype As Integer = 0 ''默認為線狀圖,1為柱狀圖,2為餅狀圖
Private backGroundColor As Color = Color.Brown ''默認背景顏色為綠色
Private lineColor As Color = Color.White ''線的顏色
Private Fontcolor As Color = Color.Black ''文字顏色
Private gvalues As ArrayList ''默認沒有值
Private gfont As New Font("arial", 10, FontStyle.Regular, GraphicsUnit.Pixel) ''默認字體
Private gfont2 As New Font("arial", 5, FontStyle.Regular, GraphicsUnit.Pixel) ''默認字體
Private RecPercent As Single = 0.8 ''柱占90%,即0.9,柱狀圖專用
Private cor() As Color = {Color.DarkOrchid, Color.DarkSalmon, Color.DarkKhaki, Color.DarkOliveGreen, Color.DarkSlateBlue, Color.DarkOrange, Color.BlueViolet, Color.BlueViolet, Color.BlueViolet, Color.BlueViolet, Color.BlueViolet, Color.BlueViolet}
#Region "屬性的訪問" > Set(ByVal value As Integer)
Public Property Width() As Integer
Get
Return gwidth
End Get
gwidth = value
End Set
End Property
Public Property Height() As Integer
Get
Return gheight
End Get
Set(ByVal value As Integer)
gheight = value
End Set
End Property
Public Property type() As Integer
Get
Return gtype
End Get
Set(ByVal value As Integer)
gtype = value
End Set
End Property
Public Property Values() As ArrayList
Get
Return gvalues
End Get
Set(ByVal value As ArrayList)
gvalues = value
End Set
End Property
#End Region
#Region "構造"
Public Sub New()
End Sub
Public Sub New(ByVal Width As Integer, ByVal Height As Integer)
gwidth = Width
gheight = Height
End Sub
#End Region
#Region "對外函數"
''對外函數
Public Function GetImageurl() As String
''生成圖片文件
Dim path As String
Dim filename As String = Guid.NewGuid.ToString + ".png"
Dim repath As String
path = (New Page).Server.MapPath("tmppng/")
If Directory.Exists(path) Then
Directory.Delete(path, True)
End If
Directory.CreateDirectory(path)
If gtype = 0 Then
''線狀圖
IO.File.WriteAllBytes(path + filename, GetChartLine())
ElseIf gtype = 1 Then
''柱狀圖
IO.File.WriteAllBytes(path + filename, GetChartRec())
ElseIf gtype = 2 Then
''餅狀圖
IO.File.WriteAllBytes(path + filename, GetChartPIE())
End If
repath = "tmppng/" + filename
Return repath
End Function
''基本生成圖形函數
Private Sub BaseDraw(ByVal g As Graphics)
End Sub
''生成線狀圖函數
Private Function GetChartLine() As Byte()
''創建流
Dim ms As New MemoryStream
''創建Bitmap
Dim img As New System.Drawing.Bitmap(gwidth,
''畫圖工具准備
Dim g As Graphics = Graphics.FromImage(img)
g.SmoothingMode = SmoothingMode.HighQuality
''背景填充
Dim br As Brush = New SolidBrush(backGroundColor)
Dim ps As PointF() = {New PointF(0, 0), New PointF(gwidth, 0), New PointF(gwidth, gheight), New PointF(0, gheight)}
g.FillClosedCurve(br, ps)
Dim i As Integer ''循環用
Dim r As ArrayList = gvalues ''存坐標點用
Dim x, y, ux, uy As Integer ''坐標點值
''找出最高點的值
Dim heightp As Single = 0
For i = 0 To r.Count - 1
If CType(CType(r(i), ListItem).Value, Single) > heightp Then heightp = CType(CType(r(i), ListItem).Value, Single)
Next
''邊距值
Dim paddingx As Integer = gwidth * 0.1
Dim paddingy As Integer = gheight * 0.1
''每結點X間距
Dim perx As Double = Math.Truncate((gwidth - paddingx * 2) / (r.Count - 1))
BaseDraw(g)
''生成坐標點,並畫線
For i = 1 To r.Count - 1
ux = (i - 1) * perx + paddingx
uy = gheight - CType(CType(r(i - 1), ListItem).Value,
Single) * (gheight / heightp) + paddingy
x = i * perx + paddingx
y = gheight - CType(CType(r(i), ListItem).Value, Single) * (gheight / heightp) + paddingy
g.DrawLine(New Pen(lineColor), ux, uy, x, y)
Next
''標值
For i = 0 To r.Count - 1
''生成柱狀圖函數
Private Function GetChartRec() As Byte()
''創建流
Dim ms As New MemoryStream
''創建Bitmap
Dim img As New System.Drawing.Bitmap(gwidth, gheight)
''畫圖工具准備
Dim g As Graphics = Graphics.FromImage(img)
g.SmoothingMode = SmoothingMode.HighQuality
''背景填充
Dim br As Brush = New SolidBrush(backGroundColor)
Dim ps As PointF() = {New PointF(0, 0), New PointF(gwidth, 0), New PointF(gwidth, gheight), New PointF(0, gheight)}
g.FillClosedCurve(br, ps)
Dim i As Integer ''循環用
Dim r As ArrayList = gvalues ''存坐標點用
Dim x, y As Integer ''坐標點值
''找出最高點的值
Dim heightp As Single = 0
For i = 0 To r.Count - 1
If CType(CType(r(i), ListItem).Value, Single) > heightp Then heightp = CType(CType(r(i), ListItem).Value, Single)
Next
''邊距值
Dim paddingx As Integer = gwidth * 0.1
Dim paddingy As Integer = gheight * 0.1
''每結點X間距
Dim perx As Double = Math.Truncate((gwidth - paddingx) / (r.Count))
Dim rec As Rectangle
BaseDraw(g)
''生成坐標點,並畫柱
For i = 0 To r.Count - 1
rec.Width = perx * RecPercent
rec.Height = CType(CType(r(i), ListItem).Value, Single) * (gheight / heightp) - paddingy * 2
rec.X = i * perx + paddingx
rec.Y = gheight - CType(CType(r(i), ListItem).Value, Single) * (gheight / heightp) + paddingy
g.FillRectangle(New SolidBrush(cor(i)), rec)
g.DrawRectangle(New Pen(lineColor), rec)
Next
''標值
For i = 0 To r.Count - 1
x = i * perx + 0.1 * perx + paddingx
y = gheight - CType(CType(r(i), ListItem).Value, Single) * (gheight / heightp) + paddingy
g.DrawString(CType(r(i), ListItem).Value, gfont, New SolidBrush(lineColor), x, y)
Next
''橫坐標X軸
g.DrawLine(New Pen(lineColor), paddingx, (gheight - paddingy), CInt(gwidth - perx * (1 - RecPercent)), (gheight - paddingy))
For i = 0 To r.Count - 1
x = paddingx + i * perx + perx * 0.3
y = gheight - paddingy
g.DrawString(CType(r(i), ListItem).Text, gfont, New SolidBrush(Fontcolor), x, y)
Next
''縱坐標Y軸
g.DrawLine(New Pen(lineColor), paddingx, paddingy, paddingx, (gheight - paddingy))
''存到流上
img.Save(ms, ImageFormat.Png)
g.Dispose()
img.Dispose()
Return ms.ToArray()
End Function
''生成餅狀圖函數
Private Function GetChartPIE() As Byte()
''創建流
Dim ms As New MemoryStream
''創建Bitmap
Dim img As New System.Drawing.Bitmap(gwidth, gheight)
''畫圖工具准備
Dim g As Graphics = Graphics.FromImage(img)
g.SmoothingMode = SmoothingMode.HighQuality
''背景填充
Dim br As Brush = New SolidBrush(backGroundColor)
Dim ps As PointF() = {New PointF(0, 0), New PointF(gwidth, 0), New PointF(gwidth, gheight), New PointF(0, gheight)}
g.FillClosedCurve(br, ps)
Dim i As Integer ''循環用
Dim r As ArrayList = gvalues ''存坐標點用
Dim x, y As Integer ''坐標點值
''找出最高點的值
Dim heightp As Single = 0
For i = 0 To r
.Count - 1
If CType(CType(r(i), ListItem).Value, Single) > heightp Then heightp = CType(CType(r(i), ListItem).Value, Single)
Next
''邊距值
Dim paddingx As Integer = gwidth * 0.1
Dim paddingy As Integer = gheight * 0.1
''每結點X間距
Dim perx As Double = Math.Truncate((gwidth - paddingx) / (r.Count))
Dim pi As Rectangle
BaseDraw(g)
Dim uv, av As Single
uv = 0
av = 0
''計算所有數量
Dim SumValue As Single = 0
For i = 0 To r.Count - 1
SumValue += CType(CType(r(i), ListItem).Value, Single)
Next
''生成坐標點,並畫圓
For i = 0 To r.Count - 1
pi.Width = gwidth - paddingx * 2
pi.Height = gheight - paddingy * 2
pi.X = paddingx
pi.Y = paddingy
av = (CType(CType(r(i), ListItem).Value, Single) / SumValue) * 360
g.DrawPIE(New Pen(lineColor), pi, uv, av) ''標值 End Class
g.FillPIE(New SolidBrush(cor(i)), pi, uv,
av)
uv = uv + av
Next
Dim yx As Single = paddingx + (gwidth - paddingx * 2) / 2 ''圓心X值
Dim yy As Single = paddingy + (gheight - paddingy * 2) / 2 ''圓心Y值
''Dim yr As Single = (gheight - paddingy * 2) / 2
Dim jd As Single ''角度
uv = 0
For i = 0 To r.Count - 1
av = (CType(CType(r(i), ListItem).Value, Single) / SumValue) * 360
jd = ((uv + (CType(CType(r(i), ListItem).Value, Single) / SumValue) * 360 / 2) * Math.PI) / 180 ''由弧度轉換為度
x = yx + Math.Cos(jd) * (pi.Width / 4)
y = yy + Math.Sin(jd) * (pi.Height / 4)
g.DrawString(CType(r(i), ListItem).Text.ToString + "(" + Math.Truncate(CType(CType(r(i), ListItem).Value, Double) * 100 / SumValue).ToString + "%)", gfont, New SolidBrush(lineColor), x, y)
uv = uv + av
Next
''存到流上
img.Save(ms, ImageFormat.Png)
g.Dispose()
img.Dispose()
Return ms.ToArray()
End Function
#End Region