Web API是網站的一部分,用於與使用非常具體的URL請求特定信息的程序交互。這種請求稱為API調用
使用API請求數據
訪問url:https://api.github.com/search/repositories?q=language:python&sort=starts
這個調用返回GitHub當前托管了多少這個調用個python項目,還有最受歡迎的python庫的信息
(https://api.github.com/)將請求發送到GitHub網站中響應API調用的部分;(search/repositories)讓API搜索GitHub上的所有倉庫;q表示查詢,而等號讓我們能夠開始指定查詢(q=);通過使用language:python,我們指出只想獲取主要語言為Python的倉庫的信息;(&sort=stars)指定將項目按其獲得的星級進行排序
從響應的結果顯示,該url不適合人工輸入。因此需要用到requests庫來處理API的響應結果
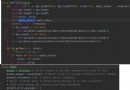
# python_repos.py
import requests
url='https://api.github.com/search/repositories?q=language:python&sort=starts'
r=requests.get(url)
# 將API響應結果存儲
print('Status code:', r.status_code)
# status_code屬性反應請求狀態是否成功
reponse_dict=r.json()
# 使用json()方法將響應結果轉換為python字典---json格式
print(reponse_dict.keys())
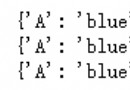
# 返回的結果
Status code: 200
dict_keys(['items', 'total_count', 'incomplete_results'])
得到json格式的響應結果後,可以進行處理數據
# python_repos.py
--snip--
print('total repositories:', response_dict['total_count'])
# 獲取repositoreis項目總數---屬性
repo_dicts=response_dict['items']
print('repositories returned:', len(repo_dicts))
repo_dict=repo_dicts[0]
# 獲取第一個項目
print('\nKeys: ', len(repo_dict))
# 獲取該項目的key數量
for n, key in enumerate(sorted(repo_dict.keys())):
print(key)
# 打印該項目的key
Hacker News,在Hacker News網站,用戶分享編程和技術方面的文章
文章舉例url 調用此url返回最熱門的文章的信息ID為9884165文章信息json
下面執行一個API調用,返回Hacker News上當前熱門文章ID,再查看每篇排名靠前的文章
# hn_submissions.py
import requests
from operator import itemgetter
url = 'https://hacker-news.firebaseio.com/v0/topstories.json'
URL = 'https://hacker-news.firebaseio.com/v0/item/'
r = requests.get(url)
print('status code: ', r.status_code)
submission_ids = r.json()
submission_dicts = []
for submission_id in submission_ids[:10]:
url = URL + str(submission_id)+'.json'
submission_r = requests.get(url)
print(submission_r.status_code)
response_dict = submission_r.json()
submission_dict = {

'title': response_dict['title'], 'link': 'http://news.ycombinator.com/item?id='+str(submission_id), 'comments': response_dict.get('descendants', 0)}
submission_dicts.append(submission_dict)
submission_dicts = sorted(
submission_dicts, key=itemgetter('comments'), reverse=True)
# 使用operator庫中itemgetter()函數,傳入參數comments,因此它將從這個列表的每個字典中key=commnets關聯,進行排序;參數reverse輸入True,即可實現comments從多到少排列
for submission_dict in submission_dicts:
print('\nTitle:', submission_dict['title'])
print('Discussion link:', submission_dict['link'])
print('Comments:', submission_dict['comments'])
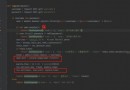
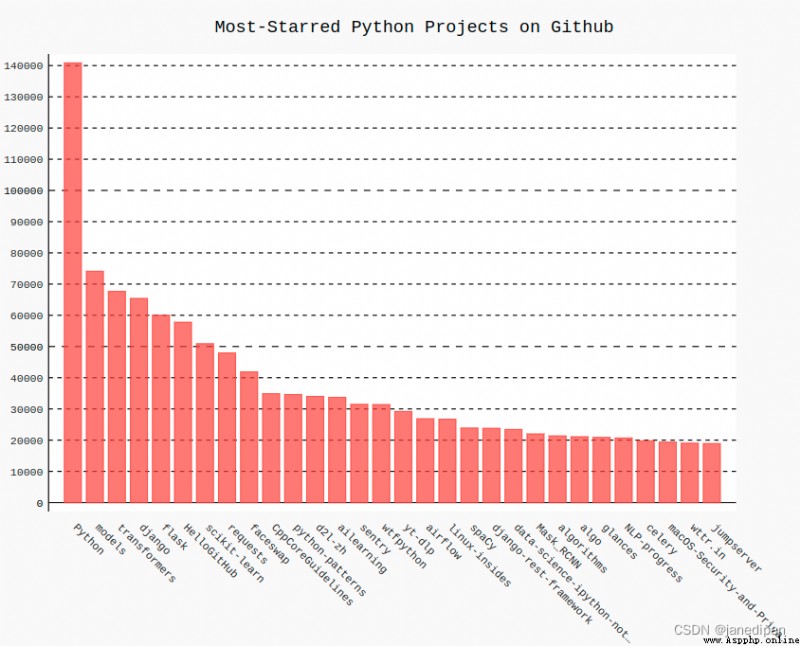
將創建一個交互式條形圖:條形圖的高度表示獲得了多少顆星,單機條形將帶你進入項目在github上的主頁
# python_repos_visual.py
import requests
import pygal
from pygal.style import LightColorizedStyle as LCS, LightenStyle as LS
URL='https://api.github.com/search/repositories?q=language:python&sort=starts'
r=requests.get(URL)
print('status code', r.status_code)
response_dict=r.json()
repo_dicts=response_dict['items']
names, starts =[], []
for repo_dict in repo_dicts:
names.append(repo_dict['name'])
starts.append(repo_dict['stargzers_count'])
my_style=LS('#3333366', base_style=LCS)
# 使用LightenStyle類定義了一種樣式,將基色設置為深藍色,並在pygal.Bar()創建條形圖實例時傳遞給參數style
chart=pygal.Bar(style=my_style, x_label_rotation=45, show_legend=False)
chart.title='Most-Starred Python Projects on Github'
chart.x_labels=names
chart.add('starts', starts)
chart.render_to_file('images/python_repos_visual.svg')
在以上實例中,鼠標指向條形碼區域會顯示獲得的星數,這稱為工具提示。下面創建一個自定義工具提示,以同時顯示項目描述。
給pygal.add()傳遞一個字典列表,而不是數值列表,字典列表包含starts—星數,label—項目描述
--snip--
names, plot_dicts =[], []
for repo_dict in repo_dicts:
names.append(repo_dict['name']
plot_dict={
'value':repo_dict['stargazers_count'], 'label':repo_dict['description'], 'xlink':repo_dict['html_url']}
# pygal會根據鍵’value‘相關聯的數值來確定條形的高度,pygal會根據'xlink’相關聯的url為每個條形轉換為活躍的鏈接
plot_dicts.append(plot_dict)
chart=pygal.Bar(x_label_rotation=45, show_legend=False)
chart.title='Most-Starred Python Projects on Github'
chart.x_labels=names
chart.add('starts', plot_dicts)
chart.render_to_file('images/python_repos_visual+.svg')