Kmeans可視化
https://www.naftaliharris.com/blog/visualizing-k-means-clustering/
K-means 有一個著名的解釋:牧師—村民模型:
有四個牧師去郊區布道,一開始牧師們隨意選了幾個布道點,並且把這幾個布道點的情況公告給了郊區所有的村民,於是每個村民到離自己家最近的布道點去聽課.
聽課之後,大家覺得距離太遠了,於是每個牧師統計了一下自己的課上所有的村民的地址,搬到了所有地址的中心地帶,並且在海報上更新了自己的布道點的位置.
牧師每一次移動不可能離所有人都更近,有的人發現A牧師移動以後自己還不如去B牧師處聽課更近,So each villager went to the nearest mission point……
就這樣,牧師每個禮拜更新自己的位置,村民根據自己的情況選擇布道點,最終穩定了下來
Kmeans,An Unsupervised Clustering Algorithm,It is also the most classic partition-based clustering method.,思想是: 對於給定的樣本集,按照樣本之間的距離大小,將樣本集劃分為K個類.Make the points in the class as close as possible,And make the distance between classes as large as possible
步驟:
例子: https://www.bilibili.com/video/BV1py4y1r7DN?share_source=copy_web
有以下6個點,將A3和A4作為初始質心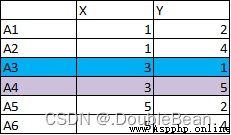
1.Calculate the distance from each point to the centroid,Classify points that are close together.從下圖可以看到A1與A3的距離是2.24,與A4的距離是3.61,所以A1被歸為A3這一類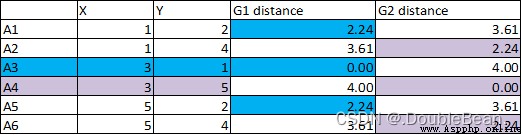
2.place each point in blue,and purple of each pointx,yValues are averaged separately.get new centroids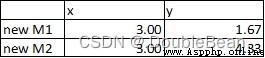
3.Calculate the new distance each point to the center of mass,Classify points that are close together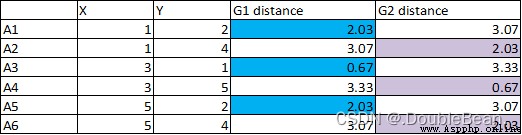
4.Since the connection point has not changed,So the result of the calculation after that will not change,停止計算
5.藍色類: A1, A3, A5.紫色類:A2, A4, A6.
# 不調庫實現
class my_Kmeans:
def __init__(self, k):
self.k = k
# 距離度量函數: Calculate the distance between arbitrary points
def calc_distance(self, vec1, vec2):
return np.sqrt(np.sum(np.power(vec1 - vec2, 2)))
def fit(self, data):
numSamples, dim = data.shape # numSamplesRefers to the total number of samples,dim指特征維度
# Random and non-repetitive selectionkdata as the initial cluster center point
self.centers_idx = np.random.choice(numSamples, self.k, replace=False) # What is obtained is the index of the centroid point
self.centers = data[self.centers_idx].astype(np.float32) # 初始化聚類中心
# ClusterAssmentRecord information for each sample: The first column records the index of the cluster center to which the sample belongs,第2The column records the square of the distance between the sample and the cluster center(用於SSE指標)
ClusterAssment = np.zeros((numSamples, 2))
ClusterChanged = True
while ClusterChanged:
ClusterChanged = False
# Iterate through all the points for each point and each cluster center distance
for i in range(numSamples):
mindist = self.calc_distance(data[i], self.centers[0])
label = 0
for j in range(1, self.k):
distance = self.calc_distance(data[i], self.centers[j])
# 把第idata is assigned to the nearest cluster center
if distance < mindist:
mindist = distance
label = j
# print("mindist = {},label = {}".format(mindist, label))
# Determine whether the cluster center to which the sample belongs has changed,Update the data if there is a change
if ClusterAssment[i, 0] != label:
ClusterChanged = True
ClusterAssment[i, :] = label, mindist ** 2
# print(ClusterAssment, '\n')
# Recalculate the cluster center for each class of samples,並更新聚類中心
for j in range(self.k):
# Find all that belong to the class centerj的樣本數據
pointsInCluster = data[ClusterAssment[:, 0] == j]
# print("{}: {}".format(j, pointsInCluster))
self.centers[j, :] = (np.mean(pointsInCluster, axis=0).tolist()) # Update the location of the cluster center
def predict(self, data):
numSamples, dim = data.shape
ClusterAssment = np.zeros((numSamples, 2))
for i in range(numSamples):
mindist = self.calc_distance(data[i], self.centers[0])
label_pred = 0
for j in range(1, self.k):
distance = self.calc_distance(data[i], self.centers[j])
if distance < mindist:
mindist = distance
label_pred = j
ClusterAssment[i, :] = label_pred, mindist ** 2
return self.centers, ClusterAssment
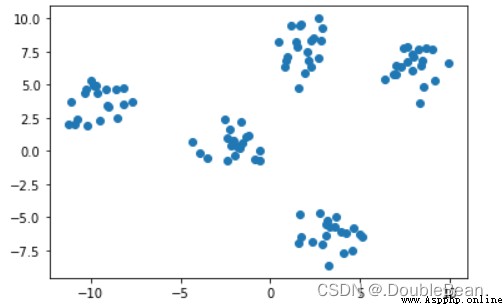
generate some datasets,來檢驗Kmeans聚類效果
import matplotlib.pyplot as plt
import numpy as np
from sklearn.datasets import make_blobs
data, true_labels = make_blobs(centers = 5, random_state = 20, cluster_std = 1) # datais the set of coordinates,ture_labels是正確標簽
plt.scatter(data[:, 0], data[:, 1])
plt.show()
# 不調庫實現
model = my_Kmeans(k=5)
model.fit(data)
''' model.fit()函數返回值 centers: 聚類中心坐標 ClusterAssment: Information for each sample: The first column records the index of the cluster center to which the sample belongs,第2The column records the square of the distance between the sample and the cluster center(用於SSE指標) '''
centers, ClusterAssment = model.predict(data)
plt.figure(figsize=(6, 5))
plt.scatter(data[:, 0], data[:, 1], c = ClusterAssment[:, 0])
plt.scatter(centers[:, 0], centers[:, 1], marker = '*', color = 'r', s = 100) # draw class center point
plt.show()
The following figure is the result of the code running,After running it several times, you will find that the library is not adjusted.KmeansClustering results will vary,That is, it is implemented without calling the libraryKmeansThe result is a local optimum in most cases,並非全局最優
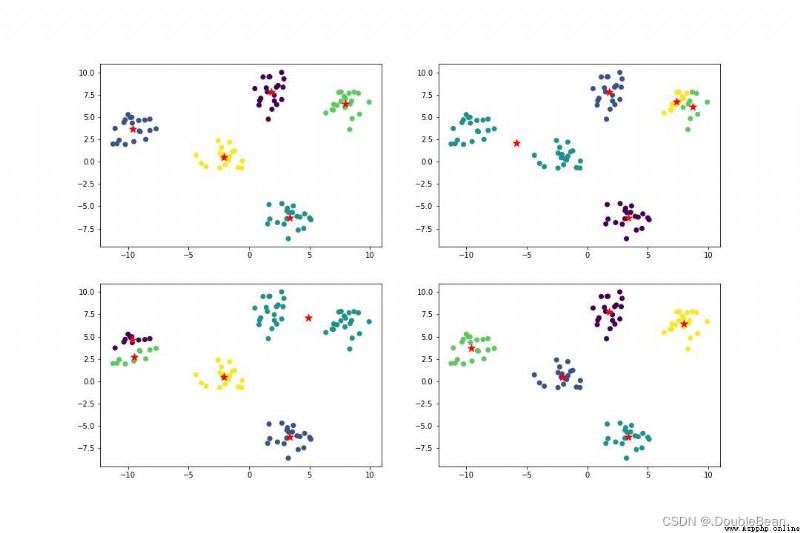
If the library is implemented,無論運行多少次,結果都很好
# 調庫實現
from sklearn.cluster import KMeans
model_1 = KMeans(n_clusters=5)
label_pred_1 = model_1.fit_predict(data)
plt.figure(figsize=(6, 5))
plt.scatter(data[:, 0], data[:, 1], c = label_pred_1)
plt.show()
缺點:
優點:
前面我們提到過K-means存在一些問題,其中一個問題就是K-meansVery sensitive to initial class centers,Kmeans++It is specially optimized for the selection of initial values.
問題點: 隨機選取k個數據,If the data is very close,will lead to slow convergence,even converges to a local minimum
The result of visible clustering is highly dependent on the initialization of the centroids,So in order to solve the initial selectionkThe center of a class of problems,引入了K-means++算法,它的核心思想是,The farther from the selected center point,The greater the probability of being selected as the next center point
那麼問題來了,Does that select the point farthest from all the selected center points as the next center point??並不是,If you do this it is easy to pick abnormal outliers,Thus affecting the final clustering effect
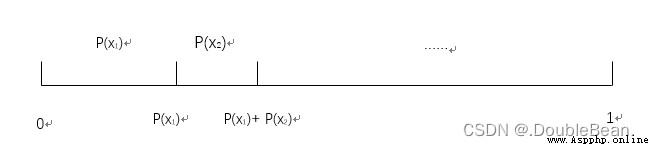
在講Kmeans之前,Let's talk about roulette,Basically a lot of articles talk about the roulette algorithm,Metropolis and Genetic Algorithms,Ant colony algorithm explained together
步驟:
舉例
The initial population fitness is [169, 576, 64, 361],Then the probability of each individual being inherited to the next generation is:
P ( x 1 ) = f ( x 1 ) ∑ j = 1 m f ( x j ) = 169 169 + 576 + 64 + 361 = 0.14 P ( x 2 ) = f ( x 2 ) ∑ j = 1 m f ( x j ) = 576 169 + 576 + 64 + 361 = 0.49 P ( x 3 ) = f ( x 3 ) ∑ j = 1 m f ( x j ) = 64 169 + 576 + 64 + 361 = 0.06 P ( x 4 ) = f ( x 4 ) ∑ j = 1 m f ( x j ) = 361 169 + 576 + 64 + 361 = 0.31 P(x_1) = \frac{f(x_1)}{\sum_{j=1}^{m} f(x_j)} = \frac{169}{169 + 576 + 64 + 361} = 0.14 \\ P(x_2) = \frac{f(x_2)}{\sum_{j=1}^{m} f(x_j)} = \frac{576}{169 + 576 + 64 + 361} = 0.49 \\ P(x_3) = \frac{f(x_3)}{\sum_{j=1}^{m} f(x_j)} = \frac{64}{169 + 576 + 64 + 361} = 0.06 \\ P(x_4) = \frac{f(x_4)}{\sum_{j=1}^{m} f(x_j)} = \frac{361}{169 + 576 + 64 + 361} = 0.31 P(x1)=∑j=1mf(xj)f(x1)=169+576+64+361169=0.14P(x2)=∑j=1mf(xj)f(x2)=169+576+64+361576=0.49P(x3)=∑j=1mf(xj)f(x3)=169+576+64+36164=0.06P(x4)=∑j=1mf(xj)f(x4)=169+576+64+361361=0.31
The cumulative probability of each individual is:
q ( x 1 ) = ∑ j = 1 1 P ( x j ) = 0.14 q ( x 2 ) = ∑ j = 1 2 P ( x j ) = 0.14 + 0.49 = 0.63 q ( x 3 ) = ∑ j = 1 3 P ( x j ) = 0.14 + 0.49 + 0.06 = 0.69 q ( x 4 ) = ∑ j = 1 1 P ( x j ) = 0.14 + 0.9 + 0.06 + 0.31 = 1 q(x_1) = \sum_{j=1}^{1} P(x_j) = 0.14 \\ q(x_2) = \sum_{j=1}^{2} P(x_j) = 0.14 + 0.49 = 0.63 \\ q(x_3) = \sum_{j=1}^{3} P(x_j) = 0.14 + 0.49 + 0.06 = 0.69 \\ q(x_4) = \sum_{j=1}^{1} P(x_j) = 0.14 + 0.9 + 0.06 + 0.31 = 1 q(x1)=j=1∑1P(xj)=0.14q(x2)=j=1∑2P(xj)=0.14+0.49=0.63q(x3)=j=1∑3P(xj)=0.14+0.49+0.06=0.69q(x4)=j=1∑1P(xj)=0.14+0.9+0.06+0.31=1

隨機產生一個數r=0.672452,found to fall[q2, q3]之間,則x3被選中
步驟:
代碼
class my_Kmeans_plus:
def __init__(self, k, init):
self.k = k
self.init = init # init='random'就是標准Kmeans,init='Kmeans++'就是Kmeans++
# 距離度量函數: Calculate the distance between arbitrary points
def calc_distance(self, vec1, vec2):
return np.sqrt(np.sum(np.power(vec1 - vec2, 2)))
''' Select the next cluster center using the roulette method 參數: Pis the probability set that each sample point is selected as the next cluster center r是區間[0, 1]a randomly generated number between,Determine which range the number falls in,then this interval is selected Returns the index of the selected sample '''
def RWS(self, P, r):
q = 0 # 累計概率
for i in range(len(P)):
q += P[i] # P[i]表示第i個樣本被選中的概率
if r <= q: # The random number generated is within the interval
return i
def fit(self, data):
numSamples, dim = data.shape # numSamplesRefers to the total number of samples,dim指特征維度
if self.init == 'random':
# Random and non-repetitive selectionkdata as the initial cluster center point
self.centers_idx = np.random.choice(numSamples, self.k, replace = False) # What is obtained is the index of the centroid point
# The default category is from0到k-1
self.centers = data[self.centers_idx].astype(np.float32) # 初始化聚類中心
# print(self.centers)
elif self.init == 'Kmeans++':
first = np.random.choice(numSamples) # Randomly select a sample point as the center of the first cluster
index_select = [first] # Store cluster center indices into a list
D = np.zeros((numSamples, 1)) # 初始化D(x)
# 繼續選取k-1個點
for j in range(1, self.k):
for i in range(numSamples):
D[i] = float('inf')
for idx in index_select:
distance = self.calc_distance(data[i], data[idx])
D[i] = min(D[i], distance)
# 計算概率
P = np.square(D) / np.sum(np.square(D))
r = np.random.random() # r為0到1的隨機數
choiced_index = self.RWS(P, r)
index_select.append(choiced_index) # Select the next cluster center using the roulette method
# print(index_select)
self.centers = data[index_select].astype(np.float32)
# print(self.centers)
# ClusterAssmentRecord information for each sample: The first column records the index of the cluster center to which the sample belongs,第2The column records the distance between the sample and the cluster center
ClusterAssment = np.zeros((numSamples, 2))
ClusterChanged = True
while ClusterChanged:
ClusterChanged = False
# Iterate through all the points for each point and each cluster center distance
for i in range(numSamples):
mindist = self.calc_distance(data[i], self.centers[0])
label = 0
for j in range(1, self.k):
distance = self.calc_distance(data[i], self.centers[j])
# 把第idata is assigned to the nearest cluster center
if distance < mindist:
mindist = distance
label = j
# print("mindist = {},label = {}".format(mindist, label))
# Determine whether the cluster center to which the sample belongs has changed,Update the data if there is a change
if ClusterAssment[i, 0] != label:
ClusterChanged = True
ClusterAssment[i, :] = label, mindist
# print(ClusterAssment, '\n')
# Recalculate the cluster center for each class of samples,並更新聚類中心
for j in range(self.k):
# Find all that belong to the class centerj的樣本數據
pointsInCluster = data[ClusterAssment[:, 0] == j]
# print("{}: {}".format(j, pointsInCluster))
self.centers[j, :] = (np.mean(pointsInCluster, axis=0).tolist()) # Update the location of the cluster center
def predict(self, data):
numSamples, dim = data.shape
ClusterAssment = np.zeros((numSamples, 2))
for i in range(numSamples):
mindist = self.calc_distance(data[i], self.centers[0])
label_pred = 0
for j in range(1, self.k):
distance = self.calc_distance(data[i], self.centers[j])
if distance < mindist:
mindist = distance
label_pred = j
ClusterAssment[i, :] = label_pred, mindist ** 2
return self.centers, ClusterAssment
調用自己寫的類
# 不調庫實現Kmeans++
model = my_Kmeans_plus(k = 5, init = 'Kmeans++')
model.fit(data)
centers, ClusterAssment = model.predict(data)
''' # 不調庫實現Kmeans model = my_Kmeans_plus(k = 5, init = 'random') model.fit(data) centers, ClusterAssment = model.predict(data) '''
plt.figure(figsize=(6, 5))
plt.scatter(data[:, 0], data[:, 1], c = ClusterAssment[:, 0])
plt.scatter(centers[:, 0], centers[:, 1], marker = '*', color = 'r', s = 100) # draw class center point
plt.show()
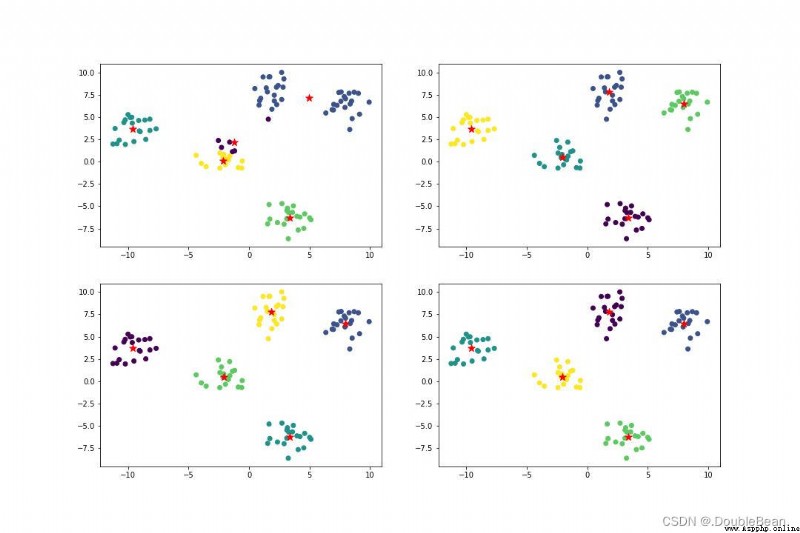
The stability of the model has been improved a bit
SSE (sum of the squared errors,誤差平方和)
S S E = ∑ i = 1 k ∑ x j ∈ C i d i s t ( x j − μ i ) 2 SSE = \sum_{i=1}^{k} \sum_{x_j ∈ C_i} dist(x_j - μ_i)^2 SSE=i=1∑kxj∈Ci∑dist(xj−μi)2
其中,Ci是第i個類,xj是Ci中的樣本點,μi是Ci的類中心(Ci中所有樣本的均值),dist是歐幾裡得距離,SSE是所有樣本的聚類誤差,It is used to evaluate the quality of clustering effect,可以理解為損失函數
Because we have to consider how to better update the class center,so that for all sample points,The sum of the distances to the class centers of the class to which it belongs is the smallest
m i n S S E = ∑ i = 1 k ∑ x j ∈ C i ( x j − μ i ) 2 = ∑ i = 1 k ∑ x j ∈ C i ( x j T x j − x j T μ i − μ i T x j + μ i T μ i ) = ∑ i = 1 k ( ∑ x j ∈ C i x j T x j − ( ∑ x j ∈ C i x j T ) μ i − μ i T ( ∑ x j ∈ C i x j ) + m i μ i T μ i ) \begin{aligned} min SSE =& \sum_{i=1}^{k} \sum_{x_j ∈ C_i} (x_j - μ_i)^2 \\ =& \sum_{i=1}^{k} \sum_{x_j ∈ C_i} (x_j^Tx_j - x_j^Tμ_i - μ_i^Tx_j + μ_i^Tμ_i) \\ =& \sum_{i=1}^{k} (\sum_{x_j ∈ C_i} x_j^Tx_j - (\sum_{x_j ∈ C_i} x_j^T)μ_i - μ_i^T(\sum_{x_j ∈ C_i} x_j) + m_i μ_i^Tμ_i) \end{aligned} minSSE===i=1∑kxj∈Ci∑(xj−μi)2i=1∑kxj∈Ci∑(xjTxj−xjTμi−μiTxj+μiTμi)i=1∑k(xj∈Ci∑xjTxj−(xj∈Ci∑xjT)μi−μiT(xj∈Ci∑xj)+miμiTμi)
其中,mi是第iThe number of sample points in each class
Derivation to Class Center:
∂ S S E ∂ μ i = − ( ∑ x j ∈ C i x j ) − ( ∑ x j ∈ C i x j ) + 2 m i μ i \frac{\partial SSE}{\partial μ_i} = - (\sum_{x_j ∈ C_i} x_j) - (\sum_{x_j ∈ C_i} x_j) + 2m_iμ_i ∂μi∂SSE=−(xj∈Ci∑xj)−(xj∈Ci∑xj)+2miμi
令 ∂ S S E ∂ μ i = 0 \frac{\partial SSE}{\partial μ_i} = 0 ∂μi∂SSE=0
μ i = 1 m i ∑ x j ∈ C i x j μ_i = \frac{1}{m_i}\sum_{x_j∈C_i} {x_j} μi=mi1xj∈Ci∑xj
由上式可知,class minimizationSSEThe best all the sample points in the center of class is the class average
前面提到Kmeans的缺點中,有提到過k值的選取對K-means影響很大.The referenced dataset makes it easy to see that the data should be divided into5類,But not all datasets are so easy to derivek值的大小,a choicekThe only way to get value is to keep trying: 手肘法
The core indicator of the elbow method isSSE
As shown in the figure is the elbow curve of the data,橫坐標是k值的選取,The ordinate is the error sum of squares,The curve shows a decreasing trend,為什麼?
當k=1時,Say not to classify sample points,Directly consider all sample points to be of the same class.當 k = numSamples,即k為樣本點的個數,Is a sample points are divided into category,The class center of each class is the sample point itself,So the center of the sample point to their class distance are for0,SSE就為0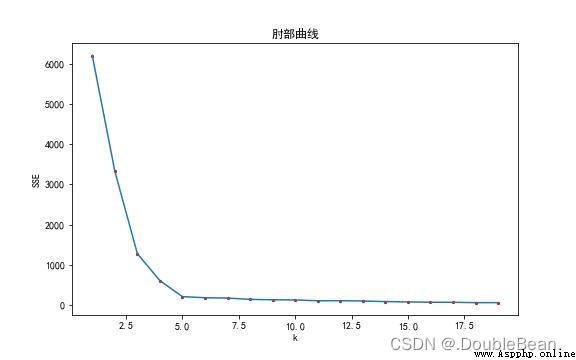
手肘法的核心思想是:隨著聚類數k的增大,樣本劃分會更加精細,每個簇的聚合程度會逐漸提高,那麼誤差平方和SSE自然會逐漸變小.並且,當k小於真實聚類數時,由於k的增大會大幅增加每個簇的聚合程度,故SSE的下降幅度會很大,而當k到達真實聚類數時,再增加k所得到的聚合程度回報會迅速變小,所以SSE的下降幅度會驟減,然後隨著k值的繼續增大而趨於平緩,也就是說SSE和k的關系圖是一個手肘的形狀,而這個肘部對應的k值就是數據的真實聚類數.當然,這也是該方法被稱為手肘法的原因
from pylab import *
mpl.rcParams['font.sans-serif'] = ['SimHei']
# Draw Elbow Curve
K = []
inertia = []
for k_num in range(20): # Here it should bedata.shape[0],But there are too many sample points in the data,而且也沒必要
model = my_Kmeans_plus(k = k_num + 1, init = 'Kmeans++')
model.fit(data)
centers, ClusterAssment = model.predict(data)
K.append(k_num + 1)
inertia.append(np.sum(ClusterAssment[:, 1]))
plt.title('elbow curve')
plt.xlabel('k')
plt.ylabel('SSE')
plt.plot(K, inertia)
plt.scatter(K, inertia, c='r', s=4)
plt.show()
調庫實現Kmeansand draw the elbow method
from sklearn.cluster import KMeans
from pylab import *
mpl.rcParams['font.sans-serif'] = ['SimHei']
sse = []
for k_num in range(1, 20):
model = KMeans(n_clusters=k_num, init="random", n_init=10, max_iter=200)
model.fit(data)
sse.append(model.inertia_)
plt.title('elbow curve')
plt.xlabel('k')
plt.ylabel('SSE')
plt.plot(range(1, 20), sse)
plt.scatter(range(1, 20), sse, c='r', s=4)
plt.show()