天氣預報我們每天都會關注,我們可以根據未來的天氣增減衣物、安排出行,每天的氣溫、風速風向、相對濕度、空氣質量等成
為關注的焦點。本次使用python中requests和BeautifulSoup庫對中國天氣網當天和未來14天的數據進行爬取,保存為csv文件,之
後用matplotlib、numpy、pandas對數據進行可視化處理和分析,得到溫濕度度變化曲線、空氣質量圖、風向雷達圖等結果,為獲
得未來天氣信息提供了有效方法。

請求網站鏈接
首先查看中國天氣網的網址:http://www.weather.com.cn/weather/101280701.shtml這裡就訪問本地的天氣網址,如果想爬取不同
的地區只需修改最後的101280701地區編號即可,前面的weather代表是7天的網頁,weather1d代表當天,weather15d代表未來
14天。這裡就主要訪問7天和14天的中國天氣網。采用requests.get()方法,請求網頁,如果成功訪問,則得到的是網頁的所有字
符串文本。這就是請求過程。

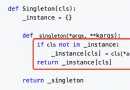
Python學習交流Q群:906715085###
def getHTMLtext(url):
"""請求獲得網頁內容"""
try:
r = requests.get(url, timeout = 30)
r.raise_for_status()
r.encoding = r.apparent_encoding
print("成功訪問")
return r.text
except:
print("訪問錯誤")
return" "
這裡采用BeautifulSoup庫對剛剛獲取的字符串進行數據提取,首先對網頁進行檢查,找到需要獲取數據的標簽:

可以發現7天的數據信息在div標簽中並且id=“7d”,並且日期、天氣、溫度、風級等信息都在ul和li標簽中,所以我們可以使用
BeautifulSoup對獲取的網頁文本進行查找div標簽id=“7d”,找出他包含的所有的ul和li標簽,之後提取標簽中相應的數據值,保存
到對應列表中。
這裡要注意一個細節就是有時日期沒有最高氣溫,對於沒有數據的情況要進行判斷和處理。另外對於一些數據保存的格式也要提
前進行處理,比如溫度後面的攝氏度符號,日期數字的提取,和風級文字的提取,這需要用到字符查找及字符串切片處理。
Python學習交流Q群:906715085###
def get_content(html):
"""處理得到有用信息保存數據文件"""
final = [] # 初始化一個列表保存數據
bs = BeautifulSoup(html, "html.parser") # 創建BeautifulSoup對象
body = bs.body
data = body.find('div', {'id': '7d'}) # 找到div標簽且id = 7d
下面爬取當天的數據
Python學習交流Q群:906715085####
data2 = body.find_all('div',{'class':'left-div'})
text = data2[2].find('script').string
text = text[text.index('=')+1 :-2] # 移除改var data=將其變為json數據
jd = json.loads(text)
dayone = jd['od']['od2'] # 找到當天的數據
final_day = [] # 存放當天的數據
count = 0
for i in dayone:
temp = []
if count <=23:
temp.append(i['od21']) # 添加時間
temp.append(i['od22']) # 添加當前時刻溫度
temp.append(i['od24']) # 添加當前時刻風力方向
temp.append(i['od25']) # 添加當前時刻風級
temp.append(i['od26']) # 添加當前時刻降水量
temp.append(i['od27']) # 添加當前時刻相對濕度
temp.append(i['od28']) # 添加當前時刻控制質量
#print(temp)
final_day.append(temp)
count = count +1
下面爬取7天的數據
ul = data.find('ul') # 找到所有的ul標簽
li = ul.find_all('li') # 找到左右的li標簽
i = 0 # 控制爬取的天數
for day in li: # 遍歷找到的每一個li
if i < 7 and i > 0:
temp = [] # 臨時存放每天的數據
date = day.find('h1').string # 得到日期
date = date[0:date.index('日')] # 取出日期號
temp.append(date)
inf = day.find_all('p') # 找出li下面的p標簽,提取第一個p標簽的值,即天氣
temp.append(inf[0].string)
tem_low = inf[1].find('i').string # 找到最低氣溫
if inf[1].find('span') is None: # 天氣預報可能沒有最高氣溫
tem_high = None
else:
tem_high = inf[1].find('span').string # 找到最高氣溫
temp.append(tem_low[:-1])
if tem_high[-1] == '℃':
temp.append(tem_high[:-1])
else:
temp.append(tem_high)
wind = inf[2].find_all('span') # 找到風向
for j in wind:
temp.append(j['title'])
wind_scale = inf[2].find('i').string # 找到風級
index1 = wind_scale.index('級')
temp.append(int(wind_scale[index1-1:index1]))
final.append(temp)
i = i + 1
return final_day,final
同樣對於/weather15d:15天的信息,也做同樣的處理,這裡經過查看後發現他的15天網頁中只有8-14天,前面的1-7天
在/weather中,這裡就分別訪問兩個網頁將爬取得到的數據進行合並得到最終14天的數據。- 前面是未來14天的數據爬取過程,
對於當天24小時的天氣信息數據,經過查找發現他是一個json數據,可以通過json.loads()
方法獲取當天的數據,進而對當天的天氣信息進行提取。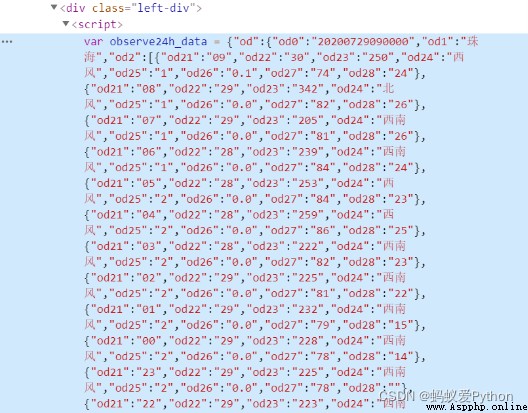

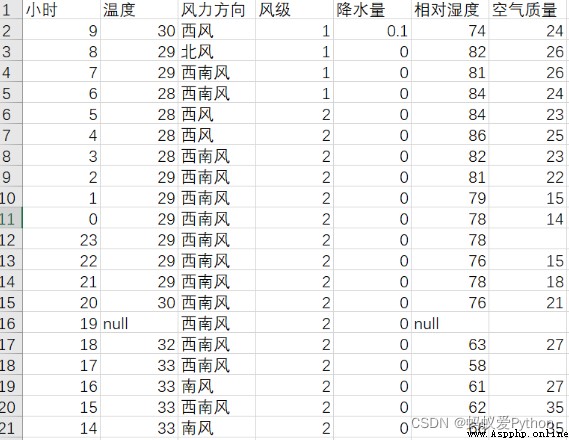
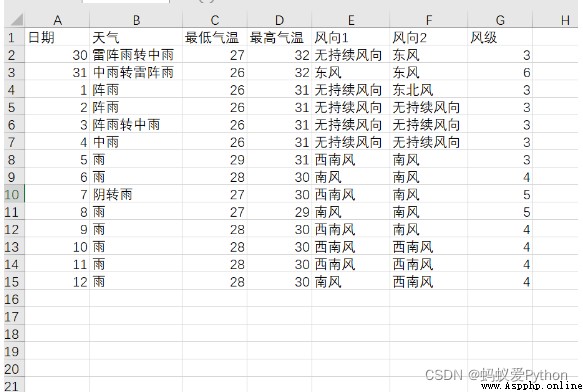
前面將爬取的數據添加到列表中,這裡引入csv庫,利用f_csv.writerow(header)和f_csv.writerows(data)方法,分別寫入表頭和每
一行的數據,這裡將1天和未來14天的數據分開存儲,分別保存為weather1.csv和weather14.csv,下面是他們保存的表格圖:
采用matplotlib中plt.plot()方法繪制出一天24小時的溫度變化曲線,並用plt.text()方法點出最高溫和最低溫,並畫出平均溫度線,下
圖為溫度變化曲線圖:(代碼見附錄)
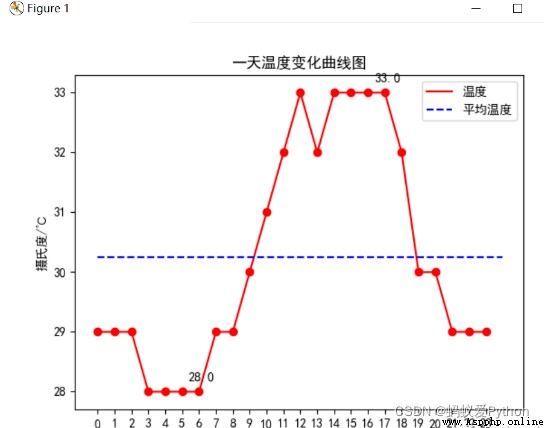
分析可以發現這一天最高溫度為33℃,最低溫度為28℃,並且平均溫度在20.4℃左右,通過對時間分析,發現晝夜溫差5℃,低
溫分布在凌晨,高溫分布在中午到下午的時間段。

采用matplotlib中plt.plot()方法繪制出一天24小時的濕度變化曲線,並畫出平均相對濕度線,下圖為濕度變化曲線圖:(代碼見附錄)
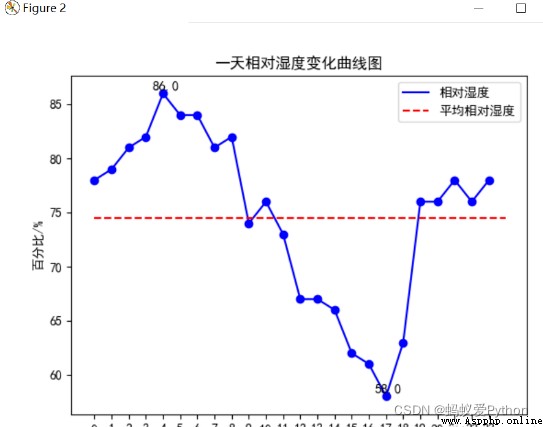
分析可以發現這一天最高相對濕度為86%,最低相對濕度為58℃,並且平均相對濕度在75%左右,通過對時間分析,清晨的濕度
比較大,而下午至黃昏濕度較小。
經過前面兩個圖的分析我們可以感覺到溫度和濕度之間是有關系的,為了更加清楚直觀地感受這種關系,使用plt.scatter()方法將
溫度為橫坐標、濕度為縱坐標,每個時刻的點在圖中點出來,並且計算相關系數,下圖為結果圖:
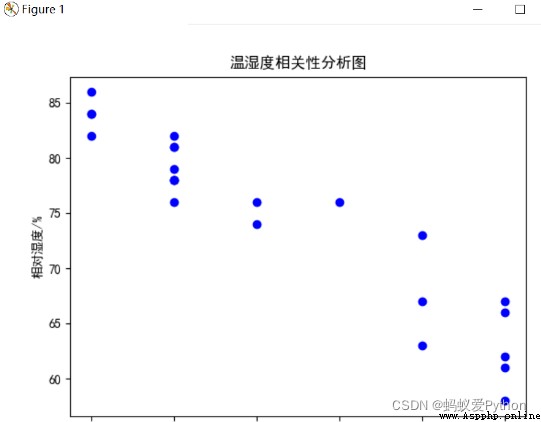
分析可以發現一天的溫度和濕度具有強烈的相關性,他們呈負相關,這就說明他們時間是負相關關系,並且進一步分析,當溫度
較低時,空氣中水分含量較多,濕度自然較高,而溫度較高時,水分蒸發,空氣就比較干 燥,濕度較低,符合平時氣候現象。

空氣質量指數AQI是定量描述空氣質量狀況的指數,其數值越大說明空氣污染狀況越重,對人體健康的危害也就越大。一般將空
氣質量指數分為6個等級,等級越高說明污染越嚴重,下面使用plt.bar方法對一天24小時的空氣質量進行了柱狀圖繪制,並且根據
6個等級的不同,相應的柱狀圖的顏色也從淺到深,也表明污染逐步加重,更直觀的顯示污染情況,並且也將最高和最低的空氣質
量指數標出,用虛線畫出平均的空氣質量指數,下圖是繪制結果圖:
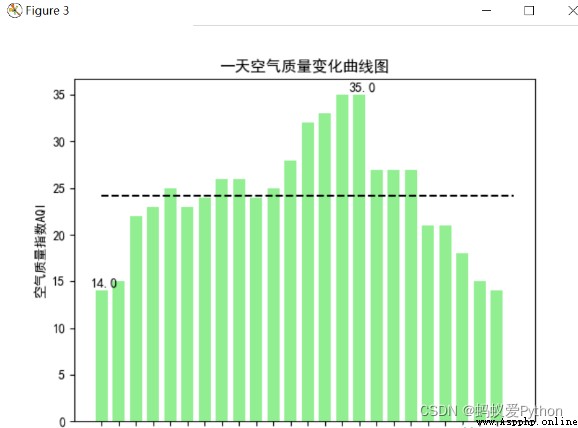
上面這張是南方珠海的控制質量圖,可以看出空氣質量指數最大也是在健康范圍,說明珠海空氣非常好,分析可以發現這一天最
高空氣質量指數達到了35,最低則只有14,並且平均在25左右,通過時間也可以發現,基本在清晨的時候是空氣最好的時候(4-
9點),在下午是空氣污染最嚴重的時候,所以清晨一般可以去外面呼吸新鮮的空氣,那時污染最小。
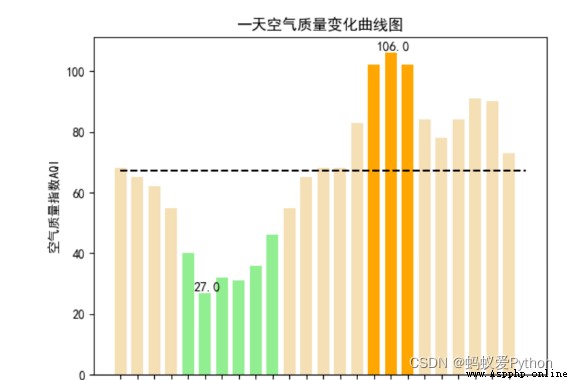
而下面這個空氣質量圖是選取的北方的一個城市,可以看到這裡的環境遠遠比不上珠海。
統計一天的風力和風向,由於風力風向使用極坐標的方式展現較好,所以這裡采用的是極坐標的方式展現一天的風力風向圖,將
圓分為8份,每一份代表一個風向,半徑代表平均風力,並且隨著風級增高,藍色加深,最後結果如下所示:
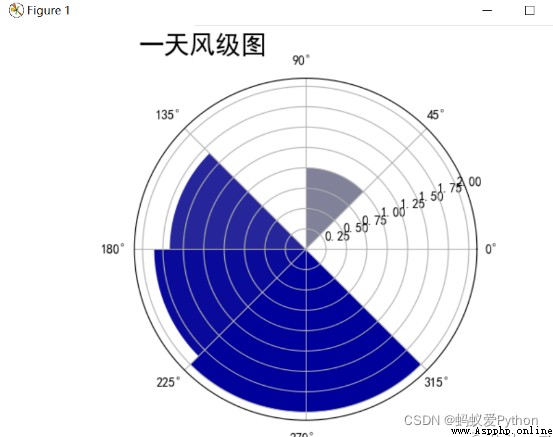
分析可以發現這一天西南風最多,平均風級達到了1.75級,東北風也有小部分1.0級,其余空白方向無來風。
未來14天高低溫變化曲線圖
統計未來14天的高低溫度變化,並繪制出他們的變化曲線圖,分別用虛線將他們的平均氣溫線繪制出來,最後結果如下所示:
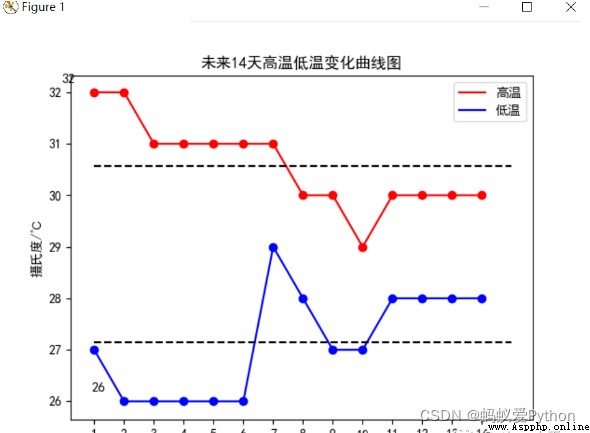
分析可以發現未來14天高溫平均氣溫為30.5℃,溫度還是比較高,但是未來的第8天有降溫,需要做好降溫准備,低溫前面處於平
穩趨勢,等到第8天開始下降,伴隨著高溫也下降,整體溫度下降,低溫平均在27℃左右。
未來14天風向風級雷達圖
統計未來14天的風向和平均風力,並和前面一樣采用極坐標形式,將圓周分為8個部分,代表8個方向,顏色越深代表風級越高,
最後結果如下所示:
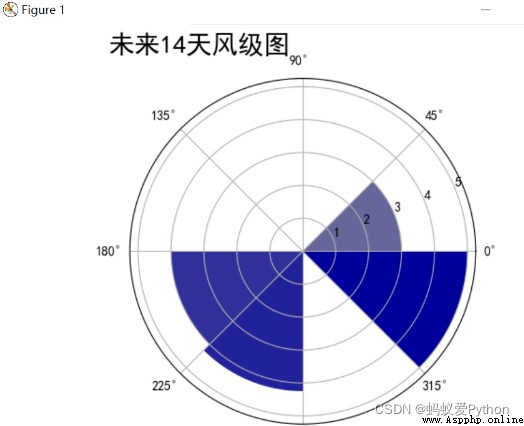
分析可以發現未來14天東南風、西南風所占主要風向,風級最高達到了5級,最低的西風平均風級也有3級。
未來14天氣候分布餅圖
統計未來14天的氣候,並求每個氣候的總天數,最後將各個氣候的餅圖繪制出來,結果如下所示:
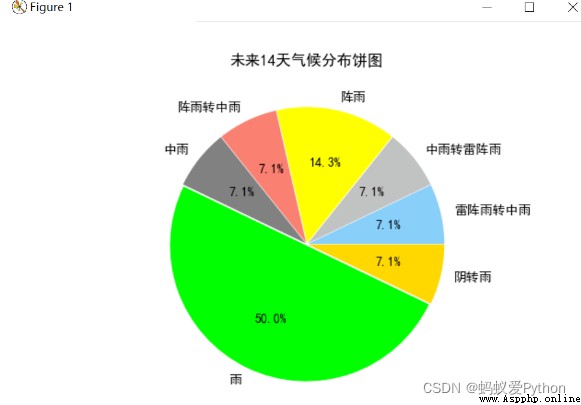
分析可以發現未來14天氣候基本是“雨”、“陰轉雨”和“陣雨”,下雨的天數較多,結合前面的氣溫分布圖可以看出在第8-9天氣溫高溫
下降,可以推測當天下雨,導致氣溫下降。

1.首先根據爬取的溫濕度數據進行的分析,溫度從早上低到中午高再到晚上低,濕度和溫度的趨勢相反,通過相關系數發現溫度
和濕度有強烈的負相關關系,經查閱資料發現因為隨著溫度升高水蒸汽蒸發加劇,空氣中水分降低濕度降低。當然,濕度同時受
氣壓和雨水的影響,下雨濕度會明顯增高。
2.經查閱資料空氣質量不僅跟工廠、汽車等排放的煙氣、廢氣等有關,更為重要的是與氣象因素有關。由於晝夜溫差明顯變化,
當地面溫度高於高空溫度時,空氣上升,污染物易被帶到高空擴散;當地面溫度低於一定高度的溫度時,天空形成逆溫層,它像
一個大蓋子一樣壓在地面上空,使地表空氣中各種污染物不易擴散。一般在晚間和清晨影響較大,而當太陽出來後,地面迅速升
溫,逆溫層就會逐漸消散,於是污染空氣也就擴散了。
3.風是由氣壓在水平方向分布的不均勻導致的。風受大氣環流、地形、水域等不同因素的綜合影響,表現形式多種多樣,如季
風、地方性的海陸風、山谷風等,一天的風向也有不同的變化,根據未來14天的風向雷達圖可以發現未來所有風向基本都有涉
及,並且沒有特別的某個風向,原因可能是近期沒有降水和氣文變化不大,導致風向也沒有太大的變化規律。
4.天氣是指某一個地區距離地表較近的大氣層在短時間內的具體狀態。跟某瞬時內大氣中各種氣象要素分布的綜合表現。根據未
來14天的天氣和溫度變化可以大致推斷出某個時間的氣候,天氣和溫度之間也是有聯系的。

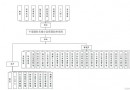
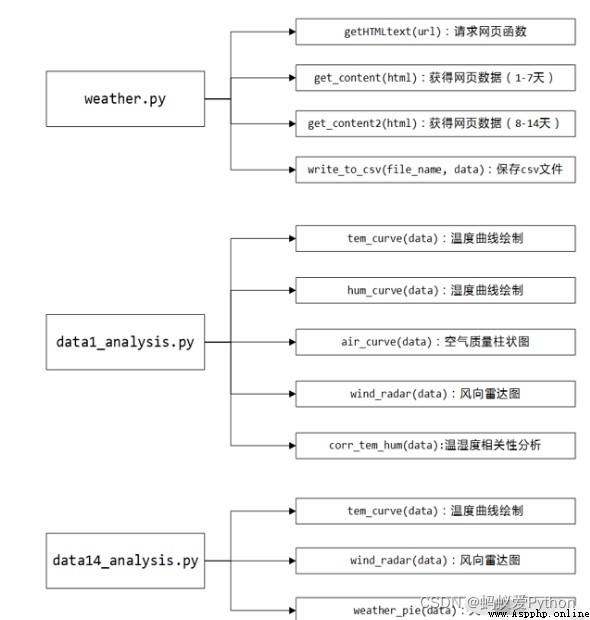
代碼主要分為weather.py:對中國天氣網進行爬取天氣數據並保存csv文件;data1_analysis.py:對當天的天氣信息進行可視化處
理;data14_analysis.py:對未來14天的天氣信息進行可視化處理。下面是代碼的結構圖:
weather.py
# weather.py
import requests
from bs4 import BeautifulSoup
import csv
import json
def getHTMLtext(url):
"""請求獲得網頁內容"""
try:
r = requests.get(url, timeout = 30)
r.raise_for_status()
r.encoding = r.apparent_encoding
print("成功訪問")
return r.text
except:
print("訪問錯誤")
return" "
def get_content(html):
"""處理得到有用信息保存數據文件"""
final = [] # 初始化一個列表保存數據
bs = BeautifulSoup(html, "html.parser") # 創建BeautifulSoup對象
body = bs.body
data = body.find('div', {<!-- -->'id': '7d'}) # 找到div標簽且id = 7d
# 下面爬取當天的數據
data2 = body.find_all('div',{<!-- -->'class':'left-div'})
text = data2[2].find('script').string
text = text[text.index('=')+1 :-2] # 移除改var data=將其變為json數據
jd = json.loads(text)
dayone = jd['od']['od2'] # 找到當天的數據
final_day = [] # 存放當天的數據
count = 0
for i in dayone:
temp = []
if count <=23:
temp.append(i['od21']) # 添加時間
temp.append(i['od22']) # 添加當前時刻溫度
temp.append(i['od24']) # 添加當前時刻風力方向
temp.append(i['od25']) # 添加當前時刻風級
temp.append(i['od26']) # 添加當前時刻降水量
temp.append(i['od27']) # 添加當前時刻相對濕度
temp.append(i['od28']) # 添加當前時刻控制質量
#print(temp)
final_day.append(temp)
count = count +1
# 下面爬取7天的數據
ul = data.find('ul') # 找到所有的ul標簽
li = ul.find_all('li') # 找到左右的li標簽
i = 0 # 控制爬取的天數
for day in li: # 遍歷找到的每一個li
if i < 7 and i > 0:
temp = [] # 臨時存放每天的數據
date = day.find('h1').string # 得到日期
date = date[0:date.index('日')] # 取出日期號
temp.append(date)
inf = day.find_all('p') # 找出li下面的p標簽,提取第一個p標簽的值,即天氣
temp.append(inf[0].string)
tem_low = inf[1].find('i').string # 找到最低氣溫
if inf[1].find('span') is None: # 天氣預報可能沒有最高氣溫
tem_high = None
else:
tem_high = inf[1].find('span').string # 找到最高氣溫
temp.append(tem_low[:-1])
if tem_high[-1] == '℃':
temp.append(tem_high[:-1])
else:
temp.append(tem_high)
wind = inf[2].find_all('span') # 找到風向
for j in wind:
temp.append(j['title'])
wind_scale = inf[2].find('i').string # 找到風級
index1 = wind_scale.index('級')
temp.append(int(wind_scale[index1-1:index1]))
final.append(temp)
i = i + 1
return final_day,final
#print(final)
def get_content2(html):
"""處理得到有用信息保存數據文件"""
final = [] # 初始化一個列表保存數據
bs = BeautifulSoup(html, "html.parser") # 創建BeautifulSoup對象
body = bs.body
data = body.find('div', {<!-- -->'id': '15d'}) # 找到div標簽且id = 15d
ul = data.find('ul') # 找到所有的ul標簽
li = ul.find_all('li') # 找到左右的li標簽
final = []
i = 0 # 控制爬取的天數
for day in li: # 遍歷找到的每一個li
if i < 8:
temp = [] # 臨時存放每天的數據
date = day.find('span',{<!-- -->'class':'time'}).string # 得到日期
date = date[date.index('(')+1:-2] # 取出日期號
temp.append(date)
weather = day.find('span',{<!-- -->'class':'wea'}).string # 找到天氣
temp.append(weather)
tem = day.find('span',{<!-- -->'class':'tem'}).text # 找到溫度
temp.append(tem[tem.index('/')+1:-1]) # 找到最低氣溫
temp.append(tem[:tem.index('/')-1]) # 找到最高氣溫
wind = day.find('span',{<!-- -->'class':'wind'}).string # 找到風向
if '轉' in wind: # 如果有風向變化
temp.append(wind[:wind.index('轉')])
temp.append(wind[wind.index('轉')+1:])
else: # 如果沒有風向變化,前後風向一致
temp.append(wind)
temp.append(wind)
wind_scale = day.find('span',{<!-- -->'class':'wind1'}).string # 找到風級
index1 = wind_scale.index('級')
temp.append(int(wind_scale[index1-1:index1]))
final.append(temp)
return final
def write_to_csv(file_name, data, day=14):
"""保存為csv文件"""
with open(file_name, 'a', errors='ignore', newline='') as f:
if day == 14:
header = ['日期','天氣','最低氣溫','最高氣溫','風向1','風向2','風級']
else:
header = ['小時','溫度','風力方向','風級','降水量','相對濕度','空氣質量']
f_csv = csv.writer(f)
f_csv.writerow(header)
f_csv.writerows(data)
def main():
"""主函數"""
print("Weather test")
# 珠海
url1 = 'http://www.weather.com.cn/weather/101280701.shtml' # 7天天氣中國天氣網
url2 = 'http://www.weather.com.cn/weather15d/101280701.shtml' # 8-15天天氣中國天氣網
html1 = getHTMLtext(url1)
data1, data1_7 = get_content(html1) # 獲得1-7天和當天的數據
html2 = getHTMLtext(url2)
data8_14 = get_content2(html2) # 獲得8-14天數據
data14 = data1_7 + data8_14
#print(data)
write_to_csv('weather14.csv',data14,14) # 保存為csv文件
write_to_csv('weather1.csv',data1,1)
if __name__ == '__main__':
main()
data1_analysis.py:
# data1_analysis.py
import matplotlib.pyplot as plt
import numpy as np
import pandas as pd
import math
def tem_curve(data):
"""溫度曲線繪制"""
hour = list(data['小時'])
tem = list(data['溫度'])
for i in range(0,24):
if math.isnan(tem[i]) == True:
tem[i] = tem[i-1]
tem_ave = sum(tem)/24 # 求平均溫度
tem_max = max(tem)
tem_max_hour = hour[tem.index(tem_max)] # 求最高溫度
tem_min = min(tem)
tem_min_hour = hour[tem.index(tem_min)] # 求最低溫度
x = []
y = []
for i in range(0, 24):
x.append(i)
y.append(tem[hour.index(i)])
plt.figure(1)
plt.plot(x,y,color='red',label='溫度') # 畫出溫度曲線
plt.scatter(x,y,color='red') # 點出每個時刻的溫度點
plt.plot([0, 24], [tem_ave, tem_ave], c='blue', linestyle='--',label='平均溫度') # 畫出平均溫度虛線
plt.text(tem_max_hour+0.15, tem_max+0.15, str(tem_max), ha='center', va='bottom', fontsize=10.5) # 標出最高溫度
plt.text(tem_min_hour+0.15, tem_min+0.15, str(tem_min), ha='center', va='bottom', fontsize=10.5) # 標出最低溫度
plt.xticks(x)
plt.legend()
plt.title('一天溫度變化曲線圖')
plt.xlabel('時間/h')
plt.ylabel('攝氏度/℃')
plt.show()
def hum_curve(data):
"""相對濕度曲線繪制"""
hour = list(data['小時'])
hum = list(data['相對濕度'])
for i in range(0,24):
if math.isnan(hum[i]) == True:
hum[i] = hum[i-1]
hum_ave = sum(hum)/24 # 求平均相對濕度
hum_max = max(hum)
hum_max_hour = hour[hum.index(hum_max)] # 求最高相對濕度
hum_min = min(hum)
hum_min_hour = hour[hum.index(hum_min)] # 求最低相對濕度
x = []
y = []
for i in range(0, 24):
x.append(i)
y.append(hum[hour.index(i)])
plt.figure(2)
plt.plot(x,y,color='blue',label='相對濕度') # 畫出相對濕度曲線
plt.scatter(x,y,color='blue') # 點出每個時刻的相對濕度
plt.plot([0, 24], [hum_ave, hum_ave], c='red', linestyle='--',label='平均相對濕度') # 畫出平均相對濕度虛線
plt.text(hum_max_hour+0.15, hum_max+0.15, str(hum_max), ha='center', va='bottom', fontsize=10.5) # 標出最高相對濕度
plt.text(hum_min_hour+0.15, hum_min+0.15, str(hum_min), ha='center', va='bottom', fontsize=10.5) # 標出最低相對濕度
plt.xticks(x)
plt.legend()
plt.title('一天相對濕度變化曲線圖')
plt.xlabel('時間/h')
plt.ylabel('百分比/%')
plt.show()
def air_curve(data):
"""空氣質量曲線繪制"""
hour = list(data['小時'])
air = list(data['空氣質量'])
print(type(air[0]))
for i in range(0,24):
if math.isnan(air[i]) == True:
air[i] = air[i-1]
air_ave = sum(air)/24 # 求平均空氣質量
air_max = max(air)
air_max_hour = hour[air.index(air_max)] # 求最高空氣質量
air_min = min(air)
air_min_hour = hour[air.index(air_min)] # 求最低空氣質量
x = []
y = []
for i in range(0, 24):
x.append(i)
y.append(air[hour.index(i)])
plt.figure(3)
for i in range(0,24):
if y[i] <= 50:
plt.bar(x[i],y[i],color='lightgreen',width=0.7) # 1等級
elif y[i] <= 100:
plt.bar(x[i],y[i],color='wheat',width=0.7) # 2等級
elif y[i] <= 150:
plt.bar(x[i],y[i],color='orange',width=0.7) # 3等級
elif y[i] <= 200:
plt.bar(x[i],y[i],color='orangered',width=0.7) # 4等級
elif y[i] <= 300:
plt.bar(x[i],y[i],color='darkviolet',width=0.7) # 5等級
elif y[i] > 300:
plt.bar(x[i],y[i],color='maroon',width=0.7) # 6等級
plt.plot([0, 24], [air_ave, air_ave], c='black', linestyle='--') # 畫出平均空氣質量虛線
plt.text(air_max_hour+0.15, air_max+0.15, str(air_max), ha='center', va='bottom', fontsize=10.5) # 標出最高空氣質量
plt.text(air_min_hour+0.15, air_min+0.15, str(air_min), ha='center', va='bottom', fontsize=10.5) # 標出最低空氣質量
plt.xticks(x)
plt.title('一天空氣質量變化曲線圖')
plt.xlabel('時間/h')
plt.ylabel('空氣質量指數AQI')
plt.show()
def wind_radar(data):
"""風向雷達圖"""
wind = list(data['風力方向'])
wind_speed = list(data['風級'])
for i in range(0,24):
if wind[i] == "北風":
wind[i] = 90
elif wind[i] == "南風":
wind[i] = 270
elif wind[i] == "西風":
wind[i] = 180
elif wind[i] == "東風":
wind[i] = 360
elif wind[i] == "東北風":
wind[i] = 45
elif wind[i] == "西北風":
wind[i] = 135
elif wind[i] == "西南風":
wind[i] = 225
elif wind[i] == "東南風":
wind[i] = 315
degs = np.arange(45,361,45)
temp = []
for deg in degs:
speed = []
# 獲取 wind_deg 在指定范圍的風速平均值數據
for i in range(0,24):
if wind[i] == deg:
speed.append(wind_speed[i])
if len(speed) == 0:
temp.append(0)
else:
temp.append(sum(speed)/len(speed))
print(temp)
N = 8
theta = np.arange(0.+np.pi/8,2*np.pi+np.pi/8,2*np.pi/8)
# 數據極徑
radii = np.array(temp)
# 繪制極區圖坐標系
plt.axes(polar=True)
# 定義每個扇區的RGB值(R,G,B),x越大,對應的顏色越接近藍色
colors = [(1-x/max(temp), 1-x/max(temp),0.6) for x in radii]
plt.bar(theta,radii,width=(2*np.pi/N),bottom=0.0,color=colors)
plt.title('一天風級圖',x=0.2,fontsize=20)
plt.show()
def calc_corr(a, b):
"""計算相關系數"""
a_avg = sum(a)/len(a)
b_avg = sum(b)/len(b)
cov_ab = sum([(x - a_avg)*(y - b_avg) for x,y in zip(a, b)])
sq = math.sqrt(sum([(x - a_avg)**2 for x in a])*sum([(x - b_avg)**2 for x in b]))
corr_factor = cov_ab/sq
return corr_factor
def corr_tem_hum(data):
"""溫濕度相關性分析"""
tem = data['溫度']
hum = data['相對濕度']
plt.scatter(tem,hum,color='blue')
plt.title("溫濕度相關性分析圖")
plt.xlabel("溫度/℃")
plt.ylabel("相對濕度/%")
plt.text(20,40,"相關系數為:"+str(calc_corr(tem,hum)),fontdict={<!-- -->'size':'10','color':'red'})
plt.show()
print("相關系數為:"+str(calc_corr(tem,hum)))
def main():
plt.rcParams['font.sans-serif']=['SimHei'] # 解決中文顯示問題
plt.rcParams['axes.unicode_minus'] = False # 解決負號顯示問題
data1 = pd.read_csv('weather1.csv',encoding='gb2312')
print(data1)
tem_curve(data1)
hum_curve(data1)
air_curve(data1)
wind_radar(data1)
corr_tem_hum(data1)
if __name__ == '__main__':
main()
data14_analysis.py:
# data14_analysis.py
import matplotlib.pyplot as plt
import numpy as np
import pandas as pd
import math
def tem_curve(data):
"""溫度曲線繪制"""
date = list(data['日期'])
tem_low = list(data['最低氣溫'])
tem_high = list(data['最高氣溫'])
for i in range(0,14):
if math.isnan(tem_low[i]) == True:
tem_low[i] = tem_low[i-1]
if math.isnan(tem_high[i]) == True:
tem_high[i] = tem_high[i-1]
tem_high_ave = sum(tem_high)/14 # 求平均高溫
tem_low_ave = sum(tem_low)/14 # 求平均低溫
tem_max = max(tem_high)
tem_max_date = tem_high.index(tem_max) # 求最高溫度
tem_min = min(tem_low)
tem_min_date = tem_low.index(tem_min) # 求最低溫度
x = range(1,15)
plt.figure(1)
plt.plot(x,tem_high,color='red',label='高溫') # 畫出高溫度曲線
plt.scatter(x,tem_high,color='red') # 點出每個時刻的溫度點
plt.plot(x,tem_low,color='blue',label='低溫') # 畫出低溫度曲線
plt.scatter(x,tem_low,color='blue') # 點出每個時刻的溫度點
plt.plot([1, 15], [tem_high_ave, tem_high_ave], c='black', linestyle='--') # 畫出平均溫度虛線
plt.plot([1, 15], [tem_low_ave, tem_low_ave], c='black', linestyle='--') # 畫出平均溫度虛線
plt.legend()
plt.text(tem_max_date+0.15, tem_max+0.15, str(tem_max), ha='center', va='bottom', fontsize=10.5) # 標出最高溫度
plt.text(tem_min_date+0.15, tem_min+0.15, str(tem_min), ha='center', va='bottom', fontsize=10.5) # 標出最低溫度
plt.xticks(x)
plt.title('未來14天高溫低溫變化曲線圖')
plt.xlabel('未來天數/天')
plt.ylabel('攝氏度/℃')
plt.show()
def change_wind(wind):
"""改變風向"""
for i in range(0,14):
if wind[i] == "北風":
wind[i] = 90
elif wind[i] == "南風":
wind[i] = 270
elif wind[i] == "西風":
wind[i] = 180
elif wind[i] == "東風":
wind[i] = 360
elif wind[i] == "東北風":
wind[i] = 45
elif wind[i] == "西北風":
wind[i] = 135
elif wind[i] == "西南風":
wind[i] = 225
elif wind[i] == "東南風":
wind[i] = 315
return wind
def wind_radar(data):
"""風向雷達圖"""
wind1 = list(data['風向1'])
wind2 = list(data['風向2'])
wind_speed = list(data['風級'])
wind1 = change_wind(wind1)
wind2 = change_wind(wind2)
degs = np.arange(45,361,45)
temp = []
for deg in degs:
speed = []
# 獲取 wind_deg 在指定范圍的風速平均值數據
for i in range(0,14):
if wind1[i] == deg:
speed.append(wind_speed[i])
if wind2[i] == deg:
speed.append(wind_speed[i])
if len(speed) == 0:
temp.append(0)
else:
temp.append(sum(speed)/len(speed))
print(temp)
N = 8
theta = np.arange(0.+np.pi/8,2*np.pi+np.pi/8,2*np.pi/8)
# 數據極徑
radii = np.array(temp)
# 繪制極區圖坐標系
plt.axes(polar=True)
# 定義每個扇區的RGB值(R,G,B),x越大,對應的顏色越接近藍色
colors = [(1-x/max(temp), 1-x/max(temp),0.6) for x in radii]
plt.bar(theta,radii,width=(2*np.pi/N),bottom=0.0,color=colors)
plt.title('未來14天風級圖',x=0.2,fontsize=20)
plt.show()
def weather_pie(data):
"""繪制天氣餅圖"""
weather = list(data['天氣'])
dic_wea = {<!-- --> }
for i in range(0,14):
if weather[i] in dic_wea.keys():
dic_wea[weather[i]] += 1
else:
dic_wea[weather[i]] = 1
print(dic_wea)
explode=[0.01]*len(dic_wea.keys())
color = ['lightskyblue','silver','yellow','salmon','grey','lime','gold','red','green','pink']
plt.pie(dic_wea.values(),explode=explode,labels=dic_wea.keys(),autopct='%1.1f%%',colors=color)
plt.title('未來14天氣候分布餅圖')
plt.show()
def main():
plt.rcParams['font.sans-serif']=['SimHei'] # 解決中文顯示問題
plt.rcParams['axes.unicode_minus'] = False # 解決負號顯示問題
data14 = pd.read_csv('weather14.csv',encoding='gb2312')
print(data14)
tem_curve(data14)
wind_radar(data14)
weather_pie(data14)
if __name__ == '__main__':
main()
用Python爬取天氣數據並做可視化分析,聽起來就是不錯的,就是敲代碼有點廢手。這密密麻麻的代碼必須給我一個大大的贊才
能哄好了。今天的分享到這裡就結束了,咱們下一章見啦。