In this paper , We will introduce how to use the image similarity measure library to compare images . According to the document of the library , We can use eight different evaluation indicators to calculate the similarity between images .
Fortunately, , All the terrible mathematical operations have been realized for us , We can start measuring image similarity immediately . We just need to call the name of the selected evaluation index and pass two images as parameters . for example :
Please note that , The default indicator is psnr.
There are two ways to use this package : You can execute commands in the terminal or write separate Python Script .
If you want a quick assessment between two images , Please run the following command in the terminal :
( Optional ) add to — metric Flag to indicate the evaluation index to be used .
In this paper , I selected three evaluation indicators :rmse,psnr and ssim.
First , Let's understand the program we are going to build :
Let's use pip or pip3 Installation Library :
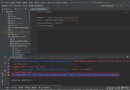
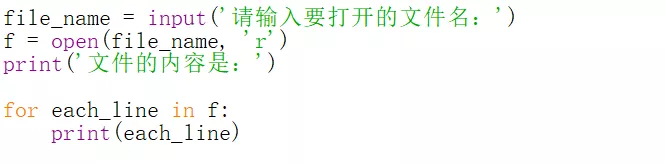
Next , Create a new Python Script file and paste the following code :
The above code analysis :
First , I will create a folder for the original images . then , I put the comparison images in the dataset folder .
This red apple will be our original query image :
We compare it with other fruits :
Now? , Let's run Python Program , Find the best match :
$ python3 measure_similarity.py red_apple.jpg
Output :
The difference between dataset/red_pear.jpg and the original image is :
0.8827639040117994
The difference between dataset/cherry.jpg and the original image is :
0.8542221298727691
The difference between dataset/green_apple.jpg and the original image is :
0.9379929447852137
The closest value: 0.9379929447852137
######################################################################
The difference between dataset/red_pear.jpg and the original image is :
0.018479494
The difference between dataset/cherry.jpg and the original image is :
0.022247538
The difference between dataset/green_apple.jpg and the original image is :
0.014238722
The closest value: 0.014238722
######################################################################
The difference between dataset/red_pear.jpg and the original image is :
55.925131298420894
The difference between dataset/cherry.jpg and the original image is :
55.43173546627284
The difference between dataset/green_apple.jpg and the original image is :
58.09926725713899
The closest value: 58.09926725713899
######################################################################
The most similar image accroding to SSIM: {
'dataset/green_apple.jpg': 0.9379929447852137}
The most similar image accroding to RMSE: {
'dataset/green_apple.jpg': 0.014238722}
The most similar image accroding to SRE: {
'dataset/green_apple.jpg': 58.09926725713899}
As you can see , The green apple is the winner . If you look at each result , You will find that the second most similar image is the red pear .
Now? , Let's see what happens when it's hard to predict the outcome . Let's put a picture of the red tomato in the dataset folder :
Here's what I'm going to say , Green apples and tomatoes look like red apples . Let's check the results according to the mathematics :
To make it more exciting , Let's try to compare more different images . Since I like painting , I took pictures of my own paintings for this experiment .
Original picture :
Image data set :
I saw two photos similar to the small house , These small houses are similar to the original photos .
Autumn scenery matches the house best .
How about these ?
At first glance , The result surprised me a little . however , When I watch carefully , The photo taken with the girl has a dark blue background , Just like the original image . The aurora borealis painting has similar mountains in the background .
As you can see , The results are different based on different evaluation indicators .
We have learned how to use different evaluation indicators to measure image similarity . The image similarity measure library implements these methods for us .
Which method is the best ?
It's hard to predict the exact result . Metrics compare images according to different aspects . It depends on how you compare the images .
Metric learning is a method directly based on distance measurement , It aims to establish the similarity or difference between images . On the other hand , Depth measurement learning uses neural networks to automatically learn the distinguishing features from images , Then calculate the metrics . Its purpose is to train models that can embed input into high-dimensional space , In order to define the training program “ be similar ” Enter close to each other . Once trained, these models can generate embeddedness for downstream systems , This similarity is useful in these systems ; Examples include one form of a pre training embedded model as a ranking signal for a search or as another monitoring problem .