代碼運行出錯
import matplotlib.pyplot as plt
import numpy as np
plt.rcParams['font.sans-serif'] = ['SimHei']
plt.rcParams['axes.unicode_minus'] = False
plt.figure()
quality1 = np.array([250,275,300,350,400]);
quality2 = np.array([250,2752,300,325,350,400]);
number_B1 = [1.4,3.4,6.7,19.3,43.6];
number_B2 = [2.8,4.4,6.2,16.2,45.1];
number_B3 = [0.4,0.6,1.1,3.3,6.0,21,1];
number_B4 = [0.5,1.1,3.0,6.1,33.5];
number_B6 = [2.8,7.5,12.6,15.9,27.0,63.2];
number_B1_1 = [6.32,8.25,12.28,25.97,25.97,41.08];
number_B2_1 = [3.26,4.97,9.32,22.88,38.7];
number_B3_1 = [2.85,5.35,7.61,7.74,13.81,21.21];
number_B4_1 = [6.62,6.62,5.05,8.33,13.1,21,45];
number_B5_1 = [4.5,4.78,8.77,16.06,22.41,30.48];
plt.plot(quality1,number_B1,color='lightgrey', linestyle='-',label='B1_乙醇轉化率,100mg')
plt.plot(quality1,number_B2,color='violet', linestyle='-.',label='B2_乙醇轉化率,200mg')
plt.plot(quality2,number_B3,color='orange', linestyle='--',label='B3_乙醇轉化率,20mg')
plt.plot(quality2,number_B4,color='lightgrey', linestyle=':',label='B4_乙醇轉化率,50mg')
plt.plot(quality2,number_B6,color='lightgrey', linestyle=':',label='B5_乙醇轉化率,150mg')
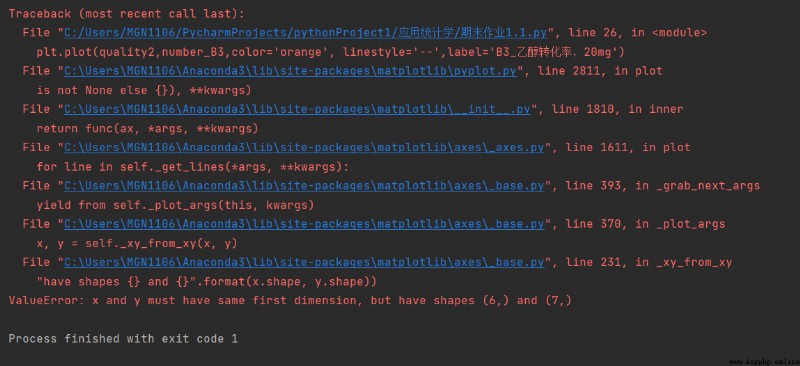
能畫出圖,解決代碼錯誤!