嗨喽,大家好呀!這裡是小熊貓
這有自己的一套模板 <通用>
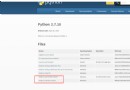
# 導入數據請求模塊
import requests
# 導入數據解析模塊
import parsel
import re
import csv
f = open('二手房多頁.csv', mode='a', encoding='utf-8', newline='')
csv_writer = csv.DictWriter(f, fieldnames=[
'標題',
'賣點',
'總價',
'單價',
'戶型',
'樓層',
'共有樓層數',
'裝修',
'朝向',
'建造時間',
'面積',
'小區',
'區域',
'所屬區',
'梯戶比例',
'是否有電梯',
'房屋屬性',
'詳情頁',
])
csv_writer.writeheader()
headers >>> 請求頭加什麼數據, 怎麼找呢?
User-Agent: 用戶代理 表示浏覽器基本身份標識… <相當於你進超市, 要看健康碼或者戴口罩>
如果你不加headers對於某些網站, 你可能被識別出來是你爬蟲程序, 被反爬 >>> 得不到數據headers 字典數據類型
for page in range(1, 11):
url = f'https://cs.lianjia.com/ershoufang/pg{page}/'
headers = {
'User-Agent': 'Mozilla/5.0 (Windows NT 10.0; WOW64) AppleWebKit/537.36 (KHTML, like Gecko) Chrome/101.0.4951.54 Safari/537.36'
}
response = requests.get(url=url, headers=headers)
# print(response.text)
selector = parsel.Selector(response.text)
# 真正的掌握css選擇器解析方法 在系統課程都是需要學習2.5個小時左右
href = selector.css('.sellListContent li.clear .title a::attr(href)').getall()
for link in href:
# url = 'https://cs.lianjia.com/ershoufang/104108664407.html'
# 發送請求
response = requests.get(url=link, headers=headers)
# print(response) # <Response [200]> 響應對象 200 狀態碼表示請求成功
# 獲取數據
# print(response.text)
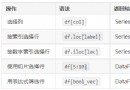
css選擇器 >>> 根據標簽屬性內容提取數據
 selector_1 = parsel.Selector(response.text) # 需要把獲取html字符串數據轉成selector對象
# print(selector)
# 復制下來僅僅只是定位到標簽, 我獲取標簽裡面title屬性
try:
# body > div.sellDetailHeader > div > div > div.title > h1
title = selector_1.css('.main::text').get() # 標題
selling_point = selector_1.css('.sub::text').get() # 賣點
price = selector_1.css('.price .total::text').get() # 總價
unitPrice = selector_1.css('.unitPrice .unitPriceValue::text').get() # 單價
house_type = selector_1.css('.room .mainInfo::text').get() # 戶型
subInfo = selector_1.css('.room .subInfo::text').get().split('/') # 樓層
floor = subInfo[0] # 樓層
num = re.findall('\d+', subInfo[1])[0] # 共有樓層數
furnish = selector_1.css('.type .subInfo::text').get().split('/')[-1] # 裝修
face = selector_1.css('.type .mainInfo::text').get() # 朝向
date = re.findall('\d+', selector_1.css('.area .subInfo::text').get()) # 建造時間
if len(date) == 0:
date = '0'
else:
date = date[0]
area = selector_1.css('.area .mainInfo::text').get().replace('平米', '') # 面積
community = selector_1.css('.communityName .info::text').get() # 小區
areaName_info = selector_1.css('.areaName .info a::text').getall() # 區域
areaName = areaName_info[0] # 所屬區
region = areaName_info[1] # 區域
scale = selector_1.css('div.content ul li:nth-child(10)::text').get() # 梯戶比例
elevator = selector_1.css('div.content ul li:nth-child(11)::text').get() # 是否有電梯
houseProperty = selector_1.css('div.content li:nth-child(2) span:nth-child(2)::text').get() # 房屋屬性
dit = {
'標題': title,
'賣點': selling_point,
'總價': price,
'單價': unitPrice,
'戶型': house_type,
'樓層': floor,
'共有樓層數': num,
'裝修': furnish,
'朝向': face,
'建造時間': date,
'面積': area,
'小區': community,
'區域': region,
'所屬區': areaName,
'梯戶比例': scale,
'是否有電梯': elevator,
'房屋屬性': houseProperty,
'詳情頁': link,
}
csv_writer.writerow(dit)
print(
title, selling_point, price, unitPrice, house_type, subInfo, furnish, face,
date, area, community, region, scale, elevator, houseProperty, link
)
except:
pass
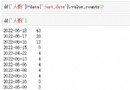
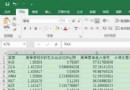
在pycharm裡面打開的,效果圖大家隨便看看就可以啦啊,沒有在ipynb裡面打開的好看~
2.1 折線圖
# 繪制各區二手房總價折線圖,是否有電梯作為評定標准
plt.figure(figsize=(12,6))
# Add title
plt.title("各區二手房總價排名")
sns.lineplot(x="所屬區", y="總價", data=data,hue=data['是否有電梯'])
# 一般有電梯的房子價格會高於無電梯的房子,但是下圖中青羊區、金牛區是例外。
# 此圖也可解釋後面的熱力圖中顯示“共有樓層數”與“單價”有一定的關系,因為有電梯就表示共有樓層數較高。
2.1.1 效果圖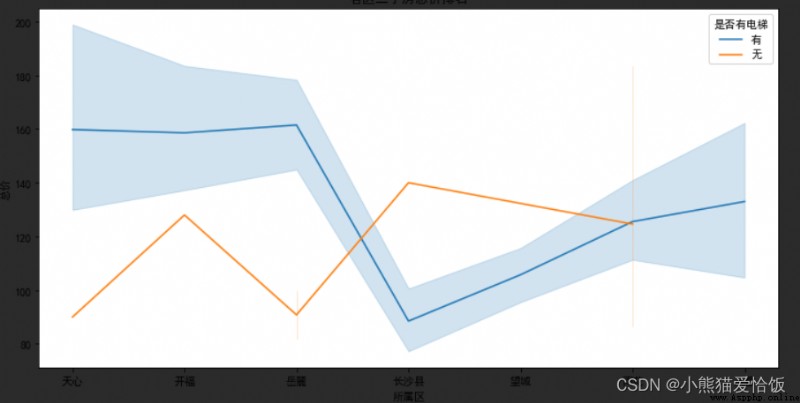
更多可視化代碼可點擊右側流動文字或下方掃免費領取哦~
2.2 各區的戶型數量對比
# 各區的戶型數量對比
plt.figure(figsize=(16,6))
huxing_num = data.groupby([data['所屬區'],data['戶型']])['小區'].count().reset_index().rename(columns={'所屬區':'所屬區','戶型':'戶型','小區':'數量'})
# print(huxing_num)
sns.barplot(x="戶型", y="數量", data=huxing_num,order=sort,hue=huxing_num['所屬區'])
# 下圖中天府新區和高新區的“3室2廳”房源數量明顯多於其他區,可以參考各區不同房型數量,針對性地篩選房源。
2.2.1 效果圖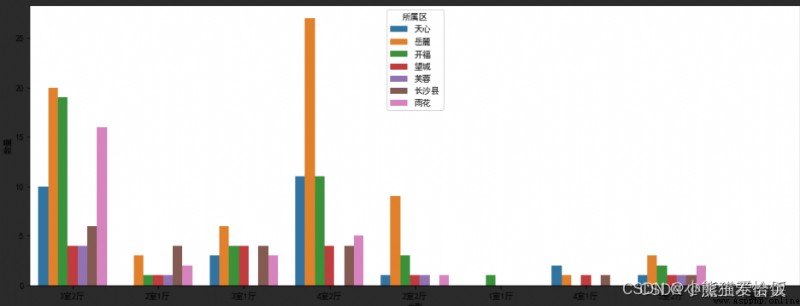
2.3 房屋屬性與單價之間的條形圖
# 繪制房屋屬性與單價之間的條形圖
plt.figure(figsize=(12,6))
shuxing = data.groupby(data['房屋屬性'])['單價'].mean().reset_index()
sns.barplot(x='房屋屬性',y='單價',data=shuxing)
2.4 繪制熱力圖
# 繪制熱力圖,觀測其他數值型變量與單價之間的關系
import numpy as np
cols = data.corr().nlargest(10,'單價')['單價'].index#局部運行,一步一步索引
cm = np.corrcoef(data[cols].values.T)
plt.subplots(figsize=(12,6))
sns.heatmap(cm, vmax=0.9,annot=True,square=True,annot_kws={'size':10},xticklabels=cols.values,yticklabels=cols.values)
# 熱力圖展示出單價與總價、共有樓層數、建造時間、面積有關系,在以上的分析中也證實了這些關系
2.4.1 效果圖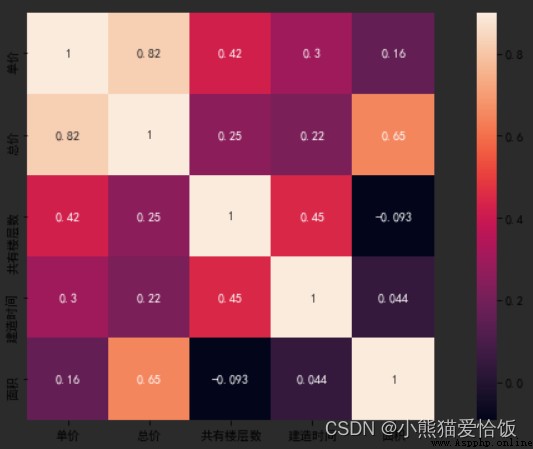
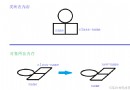
2.5 制作詞雲圖
# 繪制“房屋賣點”詞雲圖
import jieba
from PIL import Image
import wordcloud
text = ("".join(i for i in data['賣點'])) #將列數據組合到一起形成一個字符串
# print(text)
cut = jieba.cut(text)
img = Image.open('1.png') #打開遮罩照片
img_array = np.array(img) #將圖片轉換為數組
#對詞雲進行設置
wc = wordcloud.WordCloud(
background_color = 'white',
height = 800,
width = 400,#設置不同的像素,詞雲圖各詞的位置也在發生變化
mask = img_array,
font_path = 'msyh.ttc' #字體所在位置:C:\Windows\Fonts
)
wc.generate_from_text(text)
plt.figure(figsize=(20,6)) #參數的設置會改變圖片詞語的排列
plt.imshow(wc) #將詞雲放在遮罩圖片上
plt.axis('off') #是否顯示坐標軸
plt.show() #顯示生成的詞雲圖片
# 詞雲圖展示出能吸引購房者的房屋特點包括“戶型方正”、“采光好”、“中間樓層”、“精裝修”、“視野開闊”等
2.5.1 效果圖