We are here to discuss 6 It's a rookie's mistake , These errors are related to the API Or grammar , It is directly related to your level of knowledge and experience . In practice, if these problems occur, there may not be any mistakes
False prompt , But it will bring us a lot of trouble in application .
01
Use Pandas The built-in function reads the file
The first error is related to actual use Pandas To accomplish certain tasks . Specifically, the datasets of tables we are actually processing are very large . Use pandas Of read_csv Reading large files will be your biggest mistake .
Why? ? Because it's too slow ! Look at this test , We load TPS October data set , It has 1M OK and about 300 A feature , Occupied 2.2GB Of disk space .
import pandas as pd
%%time
tps_october = pd.read_csv("data/train.csv")
Wall time: 21.8 s
read_csv Spent about 22 second . You might say 22 Not many seconds . But in a project , Many experiments need to be performed at different stages . We will create many separate scripts , For cleaning 、 Feature Engineering 、 Choose a model , And other tasks . Wait for data to load many times 20 Seconds become very long . Besides , Data sets may be larger and take longer . So what is the faster solution ?
The solution is to give up at this stage Pandas, Use other for quick IO Design alternatives . My favorite is datatable, But you can also choose Dask, Vaex, cuDF etc. . This is for datatable The time required to load the same dataset :
import datatable as dt  # pip install datatble
%%time
tps_dt_october = dt.fread("data/train.csv").to_pandas()
------------------------------------------------------------
Wall time: 2 s
Only 2 second ,10 Times difference
02
No vectorization
One of the most important rules in functional programming is never to use loops . Seems to be using Pandas Stick to this “ Acyclic ” Rules are the best way to speed up computation .
Functional programming uses recursion instead of loops . Although recursion can cause various problems ( We won't consider this here ), But vectorization is the best choice for scientific computing !
Vectorization is Pandas and NumPy At the heart of , It performs mathematical operations on an entire array rather than a single scalar .Pandas Has a wide range of vectorization functions , We don't have to reinvent the wheel , Just focus on how we calculate .
stay Pandas In the middle of Python Most of the arithmetic operators of (+、-、*、/、**) Both work in a vectorized way . Besides , stay Pandas or NumPy Any other mathematical functions seen in have been vectorized .
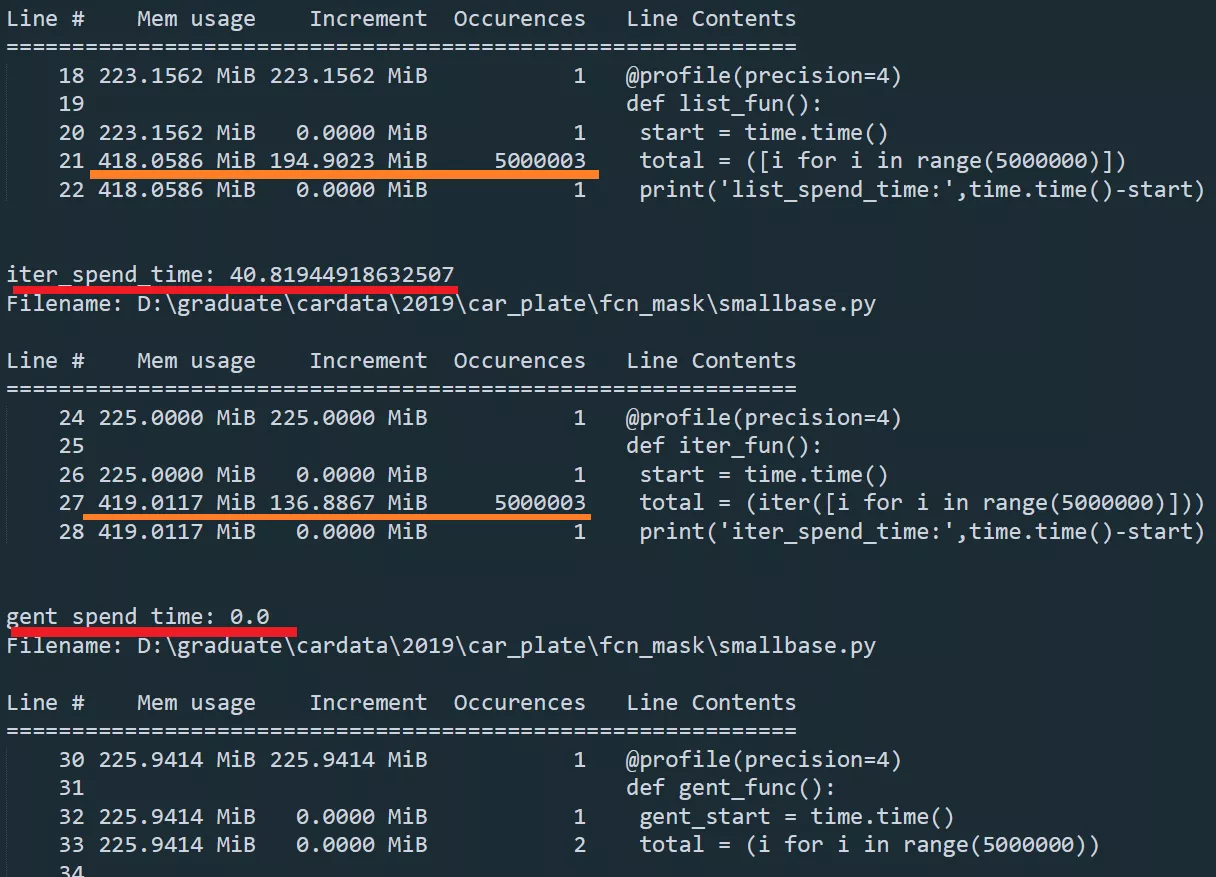
To verify the speed increase , We will use the following big_function, It takes three columns as input and performs some meaningless arithmetic as a test :
def big_function(col1, col2, col3):
    return np.log(col1 ** 10 / col2 ** 9 + np.sqrt(col3 ** 3))
First , We compare this function with Pandas The fastest iterator ——apply Use it together :
%time tps_october['f1000'] = tps_october.apply(
      lambda row: big_function(row['f0'], row['f1'], row['f2']), axis=1
    )
-------------------------------------------------
Wall time: 20.1 s
Operating time 20 second . Let's use the core in a vectorized way NumPy Array to do the same thing :
%time tps_october['f1001'] = big_function(tps_october['f0'].values,
                                          tps_october['f1'].values,
                                          tps_october['f2'].values)
------------------------------------------------------------------
Wall time: 82 ms
It only took 82 millisecond , It's about 250 times .
In fact, we can't abandon the cycle completely . Because not all data operations are mathematical operations . But every time you find that you need to use some loop functions ( for example apply、applymap or itertuples) when , It's a good habit to take a moment to see if what you want to do can be vectorized .
03
data type ,dtypes
We can specify the data type according to the memory usage .
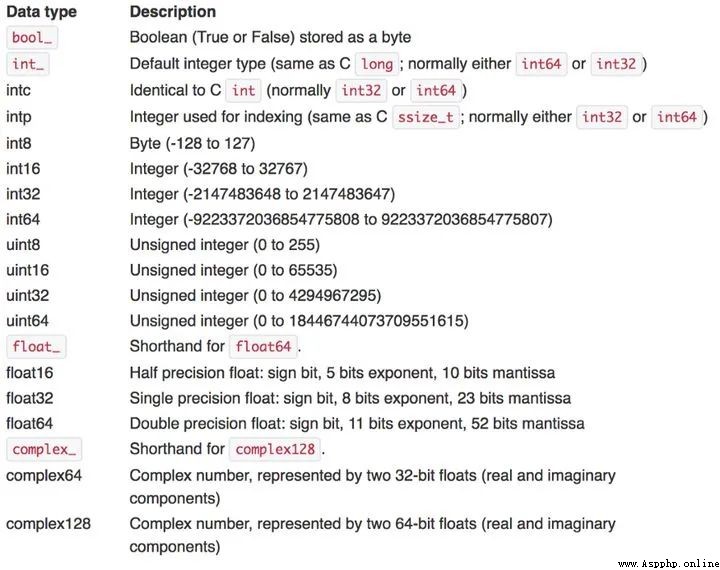
pandas The worst and most memory intensive data type in is object, This also happens to limit Pandas Some functions of . The rest of us have floating point numbers and integers . The following table is pandas All types of :
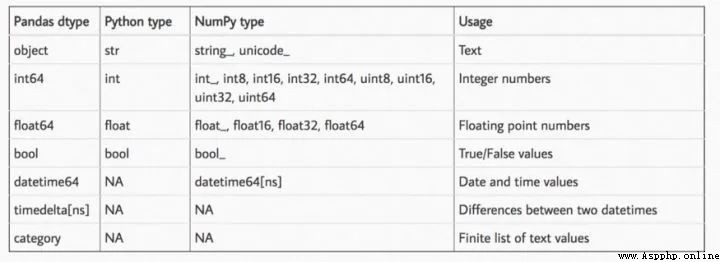
Pandas In the naming method , The number after the data type name indicates how many bits of memory each number in this data type will occupy . therefore , Our idea is to convert every column in the dataset to the smallest possible subtype . We just have to judge by the rules , This is the rule sheet :
Usually , Convert floating-point numbers to according to the above table float16/32 And convert columns with positive and negative integers to int8/16/32. Can also be uint8 For Boolean values and positive integers only , To further reduce memory consumption .
This function must be familiar to you , Because he was Kaggle Is widely used in , It converts floating-point numbers and integers to their minimum subtypes according to the above table :
def reduce_memory_usage(df, verbose=True):
    numerics = ["int8", "int16", "int32", "int64", "float16", "float32", "float64"]
    start_mem = df.memory_usage().sum() / 1024 ** 2
    for col in df.columns:
        col_type = df[col].dtypes
        if col_type in numerics:
            c_min = df[col].min()
            c_max = df[col].max()
            if str(col_type)[:3] == "int":
                if c_min > np.iinfo(np.int8).min and c_max < np.iinfo(np.int8).max:
                    df[col] = df[col].astype(np.int8)
                elif c_min > np.iinfo(np.int16).min and c_max < np.iinfo(np.int16).max:
                    df[col] = df[col].astype(np.int16)
                elif c_min > np.iinfo(np.int32).min and c_max < np.iinfo(np.int32).max:
                    df[col] = df[col].astype(np.int32)
                elif c_min > np.iinfo(np.int64).min and c_max < np.iinfo(np.int64).max:
                    df[col] = df[col].astype(np.int64)
            else:
                if (
                    c_min > np.finfo(np.float16).min
                    and c_max < np.finfo(np.float16).max
                ):
                    df[col] = df[col].astype(np.float16)
                elif (
                    c_min > np.finfo(np.float32).min
                    and c_max < np.finfo(np.float32).max
                ):
                    df[col] = df[col].astype(np.float32)
                else:
                    df[col] = df[col].astype(np.float64)
    end_mem = df.memory_usage().sum() / 1024 ** 2
    if verbose:
        print(
            "Mem. usage decreased to {:.2f} Mb ({:.1f}% reduction)".format(
                end_mem, 100 * (start_mem - end_mem) / start_mem
            )
        )
    return df
Let us in TPS Use it for October data , See how much we can reduce :
>>> reduce_memory_usage(tps_october)
Mem. usage decreased to 509.26 Mb (76.9% reduction)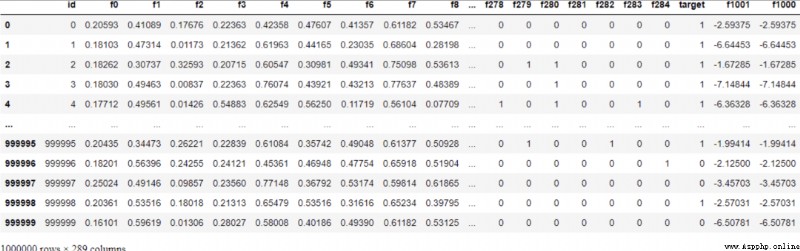
We changed the data set from the original 2.2GB Compress to 510MB. When we will df Save to csv When you file , This reduction in memory consumption is lost because csv It is also saved as a string , But if you use pickle Save it, then there's no problem .
Why reduce the memory footprint ? When dealing with such datasets using large machine learning models , The occupation and consumption of memory play an important role . Once you come across some OutOfMemory error , You will start to catch up and learn such skills to keep the computer working happily ( Who let Kaggle Only to 16G What about memory? , It's all forced out ).
04
No styling
Pandas One of the most wonderful features is that it can display DF Set different styles , stay Jupyter The original DF Rendered with some CSS HTML form .
Pandas Allowed to pass through style Attribute to its DataFrame Make style settings .
tps_october.sample(20, axis=1).describe().T.style.bar(
    subset=["mean"], color="#205ff2"
).background_gradient(subset=["std"], cmap="Reds").background_gradient(
    subset=["50%"], cmap="coolwarm"
)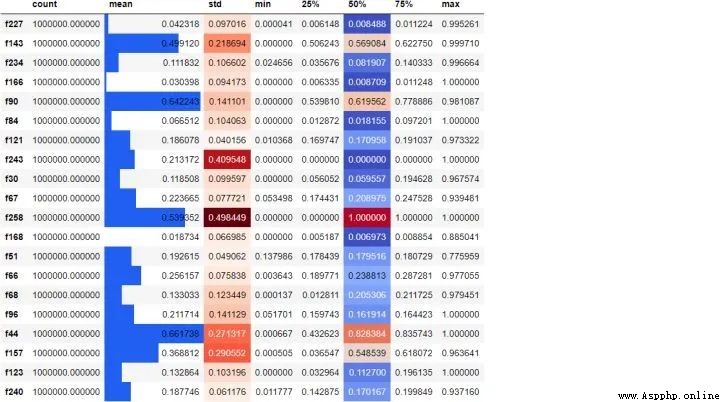
We randomly choose 20 Column , Create a... For them 5 Summary of digits , And transpose the result , According to their size, they are mean 、 Standard deviation and median column coloring . Adding such a style makes it easier to find patterns in the original numbers , No additional visualization libraries are required for setup .
actually , incorrect df There is nothing wrong with styling . But this is a really good feature , Right .
05
Use CSV Format save file
It's like reading CSV Files are very slow , Saving data back to them is the same . Here is what will be TPS October data is saved to CSV Time required :
%%time
tps_october.to_csv("data/copy.csv")
------------------------------------------
Wall time: 2min 43s
Spent nearly 3 minute . To save time, save as parquet,feather even to the extent that pickle.
%%time
tps_october.to_feather("data/copy.feather")
Wall time: 1.05 s
--------------------------------------------------------------------------------
%%time
tps_october.to_parquet("data/copy.parquet")
Wall time: 7.84 s
06
Don't look at the documents
actually , The most serious mistake for me is not reading Pandas Documents . But generally no one reads the document , Right . occasionally We would rather search the Internet for hours than read documents .
But when it comes to Pandas when , This is a very big mistake . Because it's like sklearn There is also an excellent user guide , Covers everything from basics to how to contribute code , Even how to set a more beautiful theme ( Maybe it's just too much , So no one's watching ).
All the errors I mentioned today can be found in the documentation . Even in the documentation “ Large data sets ” The section will specifically tell you to use other software packages ( Such as Dask) To read large files and stay away from Pandas. In fact, if I had time to read the user guide from beginning to end , I might suggest 50 A novice error , So let's look at the documentation .
07
summary
today , We learned that novices are using Pandas The six most common mistakes in .
Most of the errors we mentioned here are related to big data sets , Only when using GB Size data set . If you're still working on new datasets like Titanic , You may not even feel these problems . But when you start working with real-world datasets , These concepts will make people think that you are not a novice but a person who has real experience .
Long press attention - About data analysis and visualization - Set to star , Dry goods express
NO.1
Previous recommendation
Historical articles
Super graphic Pandas, Recommended collection
Pandas The value is divided into boxes 4 Methods
Read all kinds of convolutions in deep learning
100 Common indicators and terms for data analysis
Share 、 Collection 、 give the thumbs-up 、 I'm looking at the arrangement ?