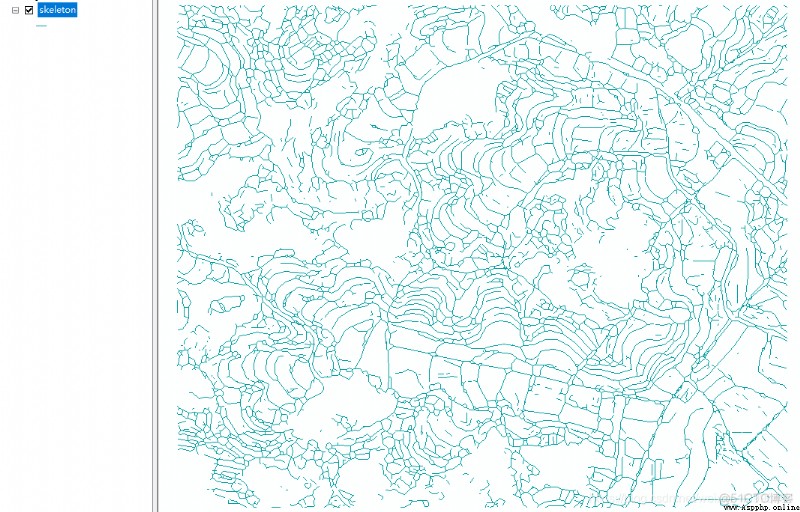
Cet article décrit comment convertir les lignes de grille en lignes vectorielles.Le processus général peut être divisé en:,Représentation de la structure de la grille,Ensuite, la relation ponctuelle de la structure graphique,Écrire un vecteur entrant.
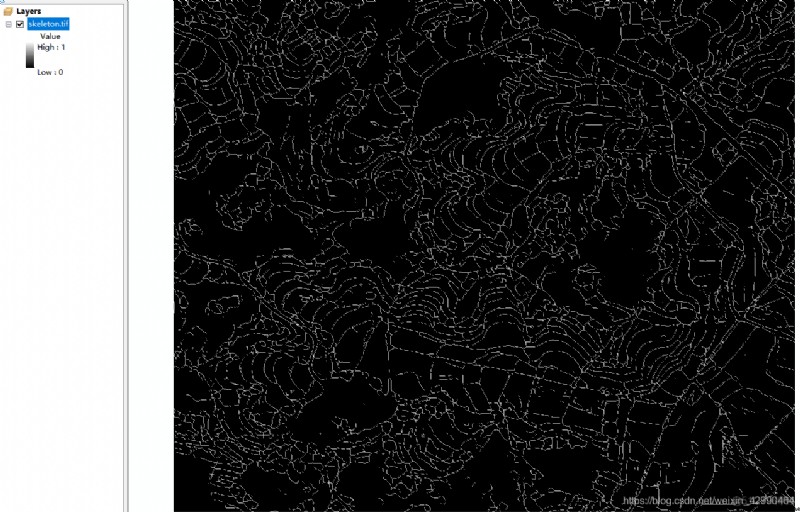
image2graph.py
# import rdp


# Code Copied From Favyen


import
scipy.
ndimage


import
skimage.
morphology


import
os


from
PIL
import
Image


import
cv2


import
math


import
numpy


from
math
import
sqrt


import
pickle


import
gdalTools


def
distance(
a,
b):


return
sqrt((
a[
0]
-
b[
0])
*
*
2
+ (
a[
1]
-
b[
1])
*
*
2)


def
point_line_distance(
point,
start,
end):


if (
start
==
end):


return
distance(
point,
start)


else:


n
=
abs(

 (
end[
0]
-
start[
0])
* (
start[
1]
-
point[
1])
- (
start[
0]
-
point[
0])
* (
end[
1]
-
start[
1])

 )


d
=
sqrt(

 (
end[
0]
-
start[
0])
*
*
2
+ (
end[
1]
-
start[
1])
*
*
2

 )


return
n
/
d


def
rdp(
points,
epsilon):


"""


 Reduces a series of points to a simplified version that loses detail, but


 maintains the general shape of the series.


 """


dmax
=
0.0


index
=
0


for
i
in
range(
1,
len(
points)
-
1):


d
=
point_line_distance(
points[
i],
points[
0],
points[
-
1])


if
d
>
dmax:


index
=
i


dmax
=
d


if
dmax
>=
epsilon:


results
=
rdp(
points[:
index
+
1],
epsilon)[:
-
1]
+
rdp(
points[
index:],
epsilon)


else:


results
= [
points[
0],
points[
-
1]]


return
results


def
generateGraph(
in_fname):


PADDING
=
30


threshold
=
1


out_fname
=
'graph_gt.pickle'


im_proj,
im_geotrans,
im_width,
im_height,
im_data
=
gdalTools.
read_img(
in_fname)


im
=
im_data


im
=
numpy.
array(
im)


if
len(
im.
shape)
==
3:


print(
'warning: bad shape {}, using first channel only'.
format(
im.
shape))


im
=
im[:, :,
0]


im
=
numpy.
swapaxes(
im,
0,
1)


im
= (
im
>=
threshold)


Image.
fromarray(
im.
astype(
'uint8')
*
60).
save(
"tmp0.png")


im
=
skimage.
morphology.
thin(
im)


im
=
im.
astype(
'uint8')


Image.
fromarray(
im
*
255).
save(
"tmp.png")


# extract a graph by placing vertices every THRESHOLD pixels, and at all intersections


vertices
= []


edges
=
set()


def
add_edge(
src,
dst):


if (
src,
dst)
in
edges
or (
dst,
src)
in
edges:


return


elif
src
==
dst:


return


edges.
add((
src,
dst))


point_to_neighbors
= {}


q
= []


while
True:


if
len(
q)
>
0:


lastid,
i,
j
=
q.
pop()


path
= [
vertices[
lastid], (
i,
j)]


if
im[
i,
j]
==
0:


continue


point_to_neighbors[(
i,
j)].
remove(
lastid)


if
len(
point_to_neighbors[(
i,
j)])
==
0:


del
point_to_neighbors[(
i,
j)]


else:


w
=
numpy.
where(
im
>
0)


if
len(
w[
0])
==
0:


break


i,
j
=
w[
0][
0],
w[
1][
0]


lastid
=
len(
vertices)


vertices.
append((
i,
j))


path
= [(
i,
j)]


while
True:


im[
i,
j]
=
0


neighbors
= []


for
oi
in [
-
1,
0,
1]:


for
oj
in [
-
1,
0,
1]:


ni
=
i
+
oi


nj
=
j
+
oj


if
ni
>=
0
and
ni
<
im.
shape[
0]
and
nj
>=
0
and
nj
<
im.
shape[
1]
and
im[
ni,
nj]
>
0:


neighbors.
append((
ni,
nj))


if
len(
neighbors)
==
1
and (
i,
j)
not
in
point_to_neighbors:


ni,
nj
=
neighbors[
0]


path.
append((
ni,
nj))


i,
j
=
ni,
nj


else:


if
len(
path)
>
1:


path
=
rdp(
path,
2)


if
len(
path)
>
2:


for
point
in
path[
1:
-
1]:


curid
=
len(
vertices)


vertices.
append(
point)


add_edge(
lastid,
curid)


lastid
=
curid


neighbor_count
=
len(
neighbors)
+
len(
point_to_neighbors.
get((
i,
j), []))


if
neighbor_count
==
0
or
neighbor_count
>=
2:


curid
=
len(
vertices)


vertices.
append(
path[
-
1])


add_edge(
lastid,
curid)


lastid
=
curid


for
ni,
nj
in
neighbors:


if (
ni,
nj)
not
in
point_to_neighbors:


point_to_neighbors[(
ni,
nj)]
=
set()


point_to_neighbors[(
ni,
nj)].
add(
lastid)


q.
append((
lastid,
ni,
nj))


for
neighborid
in
point_to_neighbors.
get((
i,
j), []):


add_edge(
neighborid,
lastid)


break


neighbors
= {}


# print(vertices)


# with open(out_fname, 'w') as f:


# for vertex in vertices:


# f.write('{} {}\n'.format(vertex[0], vertex[1]))


# f.write('\n')


vertex
=
vertices


for
edge
in
edges:


nk1
= (
vertex[
edge[
0]][
1],
vertex[
edge[
0]][
0])


nk2
= (
vertex[
edge[
1]][
1],
vertex[
edge[
1]][
0])


if
nk1
!=
nk2:


if
nk1
in
neighbors:


if
nk2
in
neighbors[
nk1]:


pass


else:


neighbors[
nk1].
append(
nk2)


else:


neighbors[
nk1]
= [
nk2]


if
nk2
in
neighbors:


if
nk1
in
neighbors[
nk2]:


pass


else:


neighbors[
nk2].
append(
nk1)


else:


neighbors[
nk2]
= [
nk1]


# f.write('{} {}\n'.format(edge[0], edge[1]))


# f.write('{} {}\n'.format(edge[1], edge[0]))


# print(neighbors)


# pickle.dump(neighbors, open(out_fname, "wb"))


return
neighbors
raster2lineShp.py
import
gdalTools


import
numpy
as
np


from
skimage
import
morphology


import
cv2
as
cv


from
osgeo
import
gdalconst,
gdal,
ogr,
osr


import
os


from
image2graph
import
*


def
imagexy2geo(
dataset,
col,
row):


'''


 SelonGDAL Le modèle à six paramètres de l'image placera les coordonnées (Numéro de colonne) Convertir en coordonnées projetées ou géographiques ( Conversion du système de coordonnées à partir de données spécifiques )


 :param dataset: GDALDonnées géographiques


 :param row: Numéro de ligne du Pixel


 :param col: Numéro de colonne du Pixel


 :return: Numéro de colonne(row, col) Coordonnées projetées ou géographiques correspondantes (x, y)


 '''


trans
=
dataset.
GetGeoTransform()


px
=
trans[
0]
+
col
*
trans[
1]
+
row
*
trans[
2]


py
=
trans[
3]
+
col
*
trans[
4]
+
row
*
trans[
5]


return
px,
py


def
raster2LineShp(
img_path,
strVectorFile):


graph
=
generateGraph(
img_path)


dataset
=
gdal.
Open(
img_path)


gdal.
SetConfigOption(
"GDAL_FILENAME_IS_UTF8",
"NO")
# Pour soutenir les chemins chinois


gdal.
SetConfigOption(
"SHAPE_ENCODING",
"CP936")
# Pour que les champs de la Feuille de propriétés supportent le chinois


ogr.
RegisterAll()


strDriverName
=
"ESRI Shapefile"
# Créer des données,Créer iciESRIDeshpDocumentation


oDriver
=
ogr.
GetDriverByName(
strDriverName)


if
oDriver
==
None:


print(
"%s L'entraînement n'est pas disponible !\n",
strDriverName)


oDS
=
oDriver.
CreateDataSource(
strVectorFile)
# Créer une source de données


if
oDS
==
None:


print(
"Créer un fichier【%s】Échec!",
strVectorFile)


# srs = osr.SpatialReference() # Créer une référence spatiale


# srs.ImportFromEPSG(4326) # Définir le système de coordonnées géographiques WGS1984


srs
=
osr.
SpatialReference(


wkt
=
dataset.
GetProjection())
# J'ai augmenté la sortie en lisant la grille dataset, Ici, vous n'avez pas besoin de spécifier la projection , Entièrement automatique , Les deux lignes ci - dessus peuvent être annotées ,Et celui - làproj Les paramètres peuvent également être supprimés , Enlevez - le vous - mêmes


papszLCO
= []


# Créer un calque, Créer une couche polygonale ,"TestPolygon"-> Nom de la Feuille de propriétés


oLayer
=
oDS.
CreateLayer(
"TestPolygon",
srs,
ogr.
wkbMultiLineString,
papszLCO)


if
oLayer
==
None:


print(
" La création du calque a échoué !\n")


oDefn
=
oLayer.
GetLayerDefn()
# Définir les éléments


oFeatureTriangle
=
ogr.
Feature(
oDefn)


# Créer une seule face


for
n,
v
in
graph.
items():


# if cls > len(cls_dict) - 1:


# continue


for
nei
in
v:


line
=
ogr.
Geometry(
ogr.
wkbLinearRing)
# Construire un type de géométrie :Ligne


nx,
ny
=
n[
1],
n[
0]


nx,
ny
=
imagexy2geo(
dataset,
nx,
ny)


line.
AddPoint(
nx,
ny)
# Ajouter un point01


neix,
neiy
=
nei[
1],
nei[
0]


neix,
neiy
=
imagexy2geo(
dataset,
neix,
neiy)


line.
AddPoint(
neix,
neiy)
# Ajouter un point02


# yard = ogr.Geometry(ogr.wkbLineString) # Construire un type de géométrie :Polygone


# yard.AddGeometry(line)


# yard.CloseRings()


# geomTriangle = ogr.CreateGeometryFromWkt(str(line)) # Ajouter un polygone fermé à la Feuille de propriétés


oFeatureTriangle.
SetGeometry(
line)


oLayer.
CreateFeature(
oFeatureTriangle)


oDS.
Destroy()


if
__name__
==
'__main__':


rasterPath
=
'./temp/skeleton.tif'


shpPath
=
'./temp/skeleton.shp'


raster2LineShp(
rasterPath,
shpPath)