MYSQL的profiling功能要在Mysql版本5.0.37以上才能使用。
查看profile是否開啟
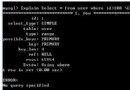
mysql> show variables like '%profil%';
+------------------------+-------+
| Variable_name     | Value |
+------------------------+-------+
| profiling       | OFF  |     --開啟SQL語句剖析功能
| profiling_history_size | 15  |     --設置保留profiling的數目,缺省為15,范圍為0至100,為0時將禁用profiling
+------------------------+-------+
2 rows in set (0.00 sec)
基於會話級別開啟
mysql> set profiling = 1; --關閉則用set profiling = off
Query OK, 0 rows affected (0.00 sec)
mysql> select distinct d.account,a.server_id from tab_appserver_user a
  -> inner join tab_department_parent b on a.key_id = b.parent_id
  -> inner join tab_department_member c on b.department_id = c.department_id and c.state=1
  -> and c.isdefault=1 inner join tab_user_info d on c.user_id = d.user_id and d.state=1
  -> where a.type=1
  -> union
  -> select distinct b.account,a.server_id from tab_appserver_user a
  -> inner join tab_user_info b on a.key_id = b.user_id and b.state=1
  -> where a.type=0;
查看是否設置生效:
select @@profiling;
默認是0,設置成功是1
運行SQL語句:
mysql> select * FROM hx_line WHERE id = '1455023';
查看profiles
mysql> show profiles;
+----------+------------+---------------------------------------------+
| Query_ID | Duration  | Query                    |
+----------+------------+---------------------------------------------+
|    1 | 0.00036150 | select * FROM hx_line WHERE id = '1455023' |
+----------+------------+---------------------------------------------+
查看具體某條的profile
mysql> show profile FOR QUERY 1;
+--------------------------------+----------+
| Status             | Duration |
+--------------------------------+----------+
| starting            | 0.000013 |
| Waiting for query cache lock  | 0.000014 |
| checking query cache for query | 0.000038 |
| checking permissions      | 0.000006 |
| Opening tables         | 0.000013 |
| System lock          | 0.000009 |
| Waiting for query cache lock  | 0.000024 |
| init              | 0.000060 |
| optimizing           | 0.000014 |
| statistics           | 0.000046 |
| preparing           | 0.000017 |
| executing           | 0.000004 |
| Sending data          | 0.000081 |
| end              | 0.000005 |
| query end           | 0.000004 |
| closing tables         | 0.000008 |
| freeing items         | 0.000009 |
| Waiting for query cache lock  | 0.000003 |
| freeing items         | 0.000013 |
| Waiting for query cache lock  | 0.000003 |
| freeing items         | 0.000003 |
| storing result in query cache | 0.000005 |
| logging slow query       | 0.000003 |
| cleaning up          | 0.000004 |
+--------------------------------+----------+
24 rows
我們看到了一個簡單的查詢,MYSQL內部做了24次操作。
另外,看到了一堆query cache的操作,試著把query_cache_size=0,把query_cache關閉,再次測試:
mysql> show profile FOR QUERY 1;
+----------------------+----------+
| Status        | Duration |
+----------------------+----------+
| starting       | 0.000040 |
| checking permissions | 0.000007 |
| Opening tables    | 0.000015 |
| System lock     | 0.000010 |
| init         | 0.000061 |
| optimizing      | 0.000013 |
| statistics      | 0.000059 |
| preparing      | 0.000018 |
| executing      | 0.000004 |
| Sending data     | 0.000092 |
| end         | 0.000006 |
| query end      | 0.000004 |
| closing tables    | 0.000008 |
| freeing items    | 0.000020 |
| logging slow query  | 0.000003 |
| cleaning up     | 0.000004 |
+----------------------+----------+
16 rows in set (0.00 sec)
當開啟了query_cache的情況下,需要多操作6次,在這個示例裡面多化了0.000087s。
查詢這條語句對CPU的使用情況:
mysql> show profile cpu FOR QUERY 1;
+----------------------+----------+----------+------------+
| Status        | Duration | CPU_user | CPU_system |
+----------------------+----------+----------+------------+
| starting       | 0.000037 | 0.000000 |  0.000000 |
| checking permissions | 0.000009 | 0.000000 |  0.000000 |
| Opening tables    | 0.000014 | 0.000000 |  0.000000 |
| System lock     | 0.000009 | 0.000000 |  0.000000 |
| init         | 0.000059 | 0.000000 |  0.000000 |
| optimizing      | 0.000009 | 0.000000 |  0.000000 |
| statistics      | 0.000044 | 0.000000 |  0.000000 |
| preparing      | 0.000015 | 0.000000 |  0.000000 |
| executing      | 0.000004 | 0.000000 |  0.000000 |
| Sending data     | 0.000081 | 0.000000 |  0.000000 |
| end         | 0.000006 | 0.000000 |  0.000000 |
| query end      | 0.000004 | 0.000000 |  0.000000 |
| closing tables    | 0.000008 | 0.000000 |  0.000000 |
| freeing items    | 0.000021 | 0.000000 |  0.000000 |
| logging slow query  | 0.000004 | 0.000000 |  0.000000 |
| cleaning up     | 0.000004 | 0.000000 |  0.000000 |
+----------------------+----------+----------+------------+
查看io及cpu的消耗
mysql> show profile block io,cpu for query 1;
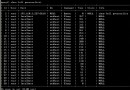
+--------------------------------+----------+----------+------------+--------------+---------------+
| Status             | Duration | CPU_user | CPU_system | Block_ops_in | Block_ops_out |
+--------------------------------+----------+----------+------------+--------------+---------------+
| starting            | 0.000018 |   NULL |    NULL |     NULL |     NULL |
| checking query cache for query | 0.000099 |   NULL |    NULL |     NULL |     NULL |
| Opening tables         | 0.000963 |   NULL |    NULL |     NULL |     NULL |
| System lock          | 0.000015 |   NULL |    NULL |     NULL |     NULL |
| Table lock           | 0.000169 |   NULL |    NULL |     NULL |     NULL |
| optimizing           | 0.000020 |   NULL |    NULL |     NULL |     NULL |
| statistics           | 0.000027 |   NULL |    NULL |     NULL |     NULL |
| preparing           | 0.000018 |   NULL |    NULL |     NULL |     NULL |
| Creating tmp table       | 0.000055 |   NULL |    NULL |     NULL |     NULL |
| executing           | 0.000003 |   NULL |    NULL |     NULL |     NULL |
| Copying to tmp table      | 0.704845 |   NULL |    NULL |     NULL |     NULL |
| Sending data          | 0.130039 |   NULL |    NULL |     NULL |     NULL |
| optimizing           | 0.000029 |   NULL |    NULL |     NULL |     NULL |
| statistics           | 0.000029 |   NULL |    NULL |     NULL |     NULL |
| preparing           | 0.000020 |   NULL |    NULL |     NULL |     NULL |
| Creating tmp table       | 0.000142 |   NULL |    NULL |     NULL |     NULL |
| executing           | 0.000003 |   NULL |    NULL |     NULL |     NULL |
| Copying to tmp table      | 0.000086 |   NULL |    NULL |     NULL |     NULL |
| Sending data          | 0.000067 |   NULL |    NULL |     NULL |     NULL |
| optimizing           | 0.000004 |   NULL |    NULL |     NULL |     NULL |
| statistics           | 0.000005 |   NULL |    NULL |     NULL |     NULL |
| preparing           | 0.000005 |   NULL |    NULL |     NULL |     NULL |
| executing           | 0.000002 |   NULL |    NULL |     NULL |     NULL |
| Sending data          | 0.023963 |   NULL |    NULL |     NULL |     NULL |
| removing tmp table       | 0.003420 |   NULL |    NULL |     NULL |     NULL |
| Sending data          | 0.000005 |   NULL |    NULL |     NULL |     NULL |
| removing tmp table       | 0.003308 |   NULL |    NULL |     NULL |     NULL |
| Sending data          | 0.000006 |   NULL |    NULL |     NULL |     NULL |
| removing tmp table       | 0.000007 |   NULL |    NULL |     NULL |     NULL |
| Sending data          | 0.000009 |   NULL |    NULL |     NULL |     NULL |
| query end           | 0.000003 |   NULL |    NULL |     NULL |     NULL |
| freeing items         | 0.000144 |   NULL |    NULL |     NULL |     NULL |
| storing result in query cache | 0.000011 |   NULL |    NULL |     NULL |     NULL |
| logging slow query       | 0.000003 |   NULL |    NULL |     NULL |     NULL |
| cleaning up          | 0.000006 |   NULL |    NULL |     NULL |     NULL |
+--------------------------------+----------+----------+------------+--------------+---------------+
35 rows in set (0.00 sec)
使用查詢語句對消耗進行排序
mysql> SELECT STATE, SUM(DURATION) AS Total_R,ROUND( 100 * SUM(DURATION) / (SE
CT SUM(DURATION)
  -> FROM INFORMATION_SCHEMA.PROFILING WHERE QUERY_ID = 1), 2) AS Pct_R, CO
T(*) AS Calls,SUM(DURATION) / COUNT(*) AS "R/Call"
  -> FROM INFORMATION_SCHEMA.PROFILING WHERE QUERY_ID = 1 GROUP BY STATE O
ER BY Total_R DESC;
+--------------------------------+----------+-------+-------+--------------+
| STATE             | Total_R | Pct_R | Calls | R/Call    |
+--------------------------------+----------+-------+-------+--------------+
| Copying to tmp table      | 0.704931 | 81.26 |   2 | 0.3524655000 |
| Sending data          | 0.154089 | 17.76 |   6 | 0.0256815000 |
| removing tmp table       | 0.006735 | 0.78 |   3 | 0.0022450000 |
| Opening tables         | 0.000963 | 0.11 |   1 | 0.0009630000 |
| Creating tmp table       | 0.000197 | 0.02 |   2 | 0.0000985000 |
| Table lock           | 0.000169 | 0.02 |   1 | 0.0001690000 |
| freeing items         | 0.000144 | 0.02 |   1 | 0.0001440000 |
| checking query cache for query | 0.000099 | 0.01 |   1 | 0.0000990000 |
| statistics           | 0.000061 | 0.01 |   3 | 0.0000203333 |
| optimizing           | 0.000053 | 0.01 |   3 | 0.0000176667 |
| preparing           | 0.000043 | 0.00 |   3 | 0.0000143333 |
| starting            | 0.000018 | 0.00 |   1 | 0.0000180000 |
| System lock          | 0.000015 | 0.00 |   1 | 0.0000150000 |
| storing result in query cache | 0.000011 | 0.00 |   1 | 0.0000110000 |
| executing           | 0.000008 | 0.00 |   3 | 0.0000026667 |
| cleaning up          | 0.000006 | 0.00 |   1 | 0.0000060000 |
| logging slow query       | 0.000003 | 0.00 |   1 | 0.0000030000 |
| query end           | 0.000003 | 0.00 |   1 | 0.0000030000 |
+--------------------------------+----------+-------+-------+--------------+
18 rows in set (0.01 sec)
show profile額外一些命令:
* ALL - displays all information
* BLOCK IO - displays counts for block input and output Operations
* CONTEXT SWITCHES - displays counts for voluntary and involuntary context switches
* ipC - displays counts for messages sent and received
* MEMORY - is not currently implemented
* PAGE FAULTS - displays counts for major and minor page faults
* SOURCE - displays the names of functions from the source code, together with the name and line number of the file in which the function occurs
* SWAPS - displays swap counts
最後說明:profile是一個非常量化的子標,可以根據這些量化指標來比較各項資源的消耗,有利於我們對該語句的整體把控!