平台:SunOS 5.8 Generic_108528-23 sun4u sparc SUNW,Ultra-Enterprise
數據庫:8.1.5.0.0
症狀:響應緩慢,應用請求已經無法返回
登陸數據庫,發現redo日志組除current外都處於active狀態
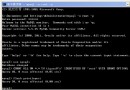
oracle:/oracle/Oracle8>sqlplus "/ as sysdba"
SQL*Plus: Release 8.1.5.0.0 - Production on Thu Jun 23 18:56:06 2005
(c) Copyright 1999 Oracle Corporation. All rights reserved.
Connected to:
Oracle8i Enterprise Edition Release 8.1.5.0.0 - Production
With the Partitioning and Java options
PL/SQL Release 8.1.5.0.0 - Production
SQL> select * from v$log;
GROUP# THREAD# SEQUENCE# BYTES MEMBERS ARC STATUS FIRST_CHANGE# FIRST_TIM
---------- ---------- ---------- ---------- ---------- --- ---------------- ------------- ---------
1 1 520403 31457280 1 NO ACTIVE 1.3861E+10 23-JUN-05
2 1 520404 31457280 1 NO ACTIVE 1.3861E+10 23-JUN-05
3 1 520405 31457280 1 NO ACTIVE 1.3861E+10 23-JUN-05
4 1 520406 31457280 1 NO CURRENT 1.3861E+10 23-JUN-05
5 1 520398 31457280 1 NO ACTIVE 1.3860E+10 23-JUN-05
6 1 520399 31457280 1 NO ACTIVE 1.3860E+10 23-JUN-05
7 1 520400 104857600 1 NO ACTIVE 1.3860E+10 23-JUN-05
8 1 520401 104857600 1 NO ACTIVE 1.3860E+10 23-JUN-05
9 1 520402 104857600 1 NO ACTIVE 1.3861E+10 23-JUN-05
9 rows selected.
SQL> /
GROUP# THREAD# SEQUENCE# BYTES MEMBERS ARC STATUS
FIRST_CHANGE# FIRST_TIM
---------- ---------- ---------- ---------- ---------- --- ---------------- ------------- ---------
1 1 520403 31457280 1 NO ACTIVE 1.3861E+10 23-JUN-05
2 1 520404 31457280 1 NO ACTIVE 1.3861E+10 23-JUN-05
3 1 520405 31457280 1 NO ACTIVE 1.3861E+10 23-JUN-05
4 1 520406 31457280 1 NO CURRENT 1.3861E+10 23-JUN-05
5 1 520398 31457280 1 NO ACTIVE 1.3860E+10 23-JUN-05
6 1 520399 31457280 1 NO ACTIVE 1.3860E+10 23-JUN-05
7 1 520400 104857600 1 NO ACTIVE 1.3860E+10 23-JUN-05
8 1 520401 104857600 1 NO ACTIVE 1.3860E+10 23-JUN-05
9 1 520402 104857600 1 NO ACTIVE 1.3861E+10 23-JUN-05
9 rows selected.
如果日志都處於active狀態,那麼顯然DBWR的寫已經無法跟上log switch觸發的檢查點。
接下來讓我們檢查一下DBWR的繁忙程度:
SQL> !
oracle:/oracle/Oracle8>ps -ef|grep ora_
Oracle 2273 1 0 Mar 31 ? 57:40 ora_smon_hysms02
Oracle 2266 1 0 Mar 31 ? 811:42 ora_dbw0_hysms02
Oracle 2264 1 16 Mar 31 ? 16999:57 ora_pmon_hysms02
Oracle 2268 1 0 Mar 31 ? 1649:07 ora_lgwr_hysms02
Oracle 2279 1 0 Mar 31 ? 8:09 ora_snp1_hysms02
Oracle 2281 1 0 Mar 31 ? 4:22 ora_snp2_hysms02
Oracle 2285 1 0 Mar 31 ? 9:40 ora_snp4_hysms02
Oracle 2271 1 0 Mar 31 ? 15:57 ora_ckpt_hysms02
Oracle 2283 1 0 Mar 31 ?
DBWR的進程號是2266。
使用Top命令觀察一下:
oracle:/oracle/Oracle8>top
last pid: 21145; load averages: 3.38, 3.45, 3.67 18:53:38
725 processes: 711 sleeping, 1 running, 10 zombIE, 3 on cpu
CPU states: 35.2% idle, 40.1% user, 9.4% kernel, 15.4% iowait, 0.0% swap
Memory: 3072M real, 286M free, 3120M swap in use, 1146M swap free
PID USERNAME THR PRI NICE SIZE RES STATE TIME CPU COMMAND
11855 smspf 1 59 0 1355M 1321M cpu/0 19:32 16.52% Oracle
2264 oracle 1 0 0 1358M 1316M run 283.3H 16.36% Oracle
11280 oracle 1 13 0 1356M 1321M sleep 79.8H 0.77% Oracle
6957 smspf 15 29 10 63M 14M sleep 107.7H 0.76% Java
17393 smspf 1 30 0 1356M 1322M cpu/1 833:05 0.58% Oracle
29299 smspf 5 58 0 8688K 5088K sleep 18.5H 0.38% fee_FTP_get
21043 Oracle 1 43 0 3264K 2056K cpu/9 0:01 0.31% top
20919 smspf 17 29 10 63M 17M sleep 247:02 0.29% Java
25124 smspf 1 58 0 16M 4688K sleep 0:35 0.25% smif_status_rec
8086 smspf 5 23 0 21M 13M sleep 41.1H 0.24% fee_file_in
16009 root 1 35 0 4920K 3160K sleep 0:03 0.21% sshd2
25126 smspf 1 58 0 1355M 1321M sleep 0:26 0.20% Oracle
2266 oracle 1 60 0 1357M 1317M sleep 811:42 0.18% Oracle
11628 smspf 7 59 0 3440K 20
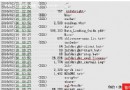
我們注意到,2266號進程消耗的CPU不過0.18%,顯然並不繁忙,那麼瓶頸就很可能在IO上。 我們注意到,存放數據庫的主要卷c1t1d0的繁忙程度始終處於99~100,而寫速度卻只有500K/s左右,這個速度是極為緩慢的。 Posted by eygle at June 26, 2005
使用iOSTAT工具檢查IO狀況。
gqgai:/home/gqgai>iOStat -xn 3
extended device statistics
r/s w/s kr/s kw/s wait actv wsvc_t asvc_t %w %b device
......
0.0 0.0 0.0 0.0 0.0 0.0 0.0 0.0 0 0 c0t6d0
1.8 38.4 32.4 281.0 0.0 0.7 0.0 16.4 0 29 c0t10d0
1.8 38.4 32.4 281.0 0.0 0.5 0.0 13.5 0 27 c0t11d0
24.8 61.3 1432.4 880.1 0.0 0.5 0.0 5.4 0 26 c1t1d0
0.0 0.0 0.0 0.0 0.0 0.0 0.0 9.1 0 0 hurraysms02:vold(pid238)
extended device statistics
r/s w/s kr/s kw/s wait actv wsvc_t asvc_t %w %b device
........
0.0 0.0 0.0 0.0 0.0 0.0 0.0 0.0 0 0 c0t6d0
0.3 8.3 0.3 47.0 0.0 0.1 0.0 9.2 0 8 c0t10d0
0.0 8.3 0.0 47.0 0.0 0.1 0.0 8.0 0 7 c0t11d0
11.7 65.3 197.2 522.2 0.0 1.6 0.0 20.5 0 100 c1t1d0
0.0 0.0 0.0 0.0 0.0 0.0 0.0 0.0 0 0 hurraysms02:vold(pid238)
extended device statistics
r/s w/s kr/s kw/s wait actv wsvc_t asvc_t %w %b device
........
0.0 0.0 0.0 0.0 0.0 0.0 0.0 0.0 0 0 c0t6d0
0.3 13.7 2.7 68.2 0.0 0.2 0.0 10.9 0 12 c0t10d0
0.0 13.7 0.0 68.2 0.0 0.1 0.0 9.6 0 11 c0t11d0
11.3 65.3 90.7 522.7 0.0 1.5 0.0 19.5 0 99 c1t1d0
0.0 0.0 0.0 0.0 0.0 0.0 0.0 0.0 0 0 hurraysms02:vold(pid238)
r/s w/s kr/s kw/s wait actv wsvc_t asvc_t %w %b device
........
0.0 0.0 0.0 0.0 0.0 0.0 0.0 0.0 0 0 c0t6d0
0.0 8.0 0.0 42.7 0.0 0.1 0.0 9.3 0 7 c0t10d0
0.0 8.0 0.0 42.7 0.0 0.1 0.0 9.1 0 7 c0t11d0
11.0 65.7 978.7 525.3 0.0 1.4 0.0 17.7 0 99 c1t1d0
0.0 0.0 0.0 0.0 0.0 0.0 0.0 0.0 0 0 hurraysms02:vold(pid238)
extended device statistics
r/s w/s kr/s kw/s wait actv wsvc_t asvc_t %w %b device
........
0.0 0.0 0.0 0.0 0.0 0.0 0.0 0.0 0 0 c0t6d0
0.3 87.7 2.7 433.7 0.0 2.2 0.0 24.9 0 90 c0t10d0
0.0 88.3 0.0 436.5 0.0 1.8 0.0 19.9 0 81 c0t11d0
89.0 54.0 725.4 432.0 0.0 2.1 0.0 14.8 0 100 c1t1d0
0.0 0.0 0.0 0.0 0.0 0.0 0.0 0.0 0 0 hurraysms02:vold(pid238)
(%b percent of time the disk is busy (transactions in progress)
Kw/s kilobytes written per second)
根據我們的常識T3盤陣通常按Char寫速度可以達到10M/s左右,以前測試過一些Tpcc指標,可以參考:Use bonnIE to Test system IO speed。
而正常情況下的數據庫隨機寫通常都在1~2M左右,顯然此時的磁盤已經處於不正常狀態,經過確認的確是硬盤發生了損壞,Raid5的Group中損壞了一塊硬盤。
經過更換以後系統逐漸恢復正常。