之前公司客戶有出現過一種情況,是使用sysbench 進行壓力測試,在測試的過程中發生一個現象,如下所示
下面是客戶那裡的輸出結果:
[1310s] threads: 600, tps: 2176.70, reads: 1087.10, writes: 1089.60, response time: 1076.07ms (95%), errors: 0.00, reconnects:  0.00
[1320s] threads: 600, tps: 2292.10, reads: 1144.30, writes: 1147.80, response time: 805.14ms (95%), errors: 0.00, reconnects:  0.00
[1330s] threads: 600, tps: 2205.90, reads: 1103.30, writes: 1102.60, response time: 969.33ms (95%), errors: 0.00, reconnects:  0.00
[1340s] threads: 600, tps: 2038.20, reads: 1015.80, writes: 1022.40, response time: 920.41ms (95%), errors: 0.00, reconnects:  0.00
[1350s] threads: 600, tps: 2002.90, reads: 998.90, writes: 1004.00, response time: 1096.88ms (95%), errors: 0.00, reconnects:  0.00
[1360s] threads: 600, tps: 2002.90, reads: 1000.10, writes: 1002.80, response time: 1108.77ms (95%), errors: 0.00, reconnects:  0.00
[1370s] threads: 600, tps: 2114.90, reads: 1057.60, writes: 1057.30, response time: 930.94ms (95%), errors: 0.00, reconnects:  0.00
[1380s] threads: 600, tps: 2073.30, reads: 1033.90, writes: 1039.40, response time: 967.59ms (95%), errors: 0.00, reconnects:  0.00
[1390s] threads: 600, tps: 2314.09, reads: 1153.99, writes: 1160.09, response time: 1016.58ms (95%), errors: 0.00, reconnects:  0.00
[1400s] threads: 600, tps: 1850.91, reads: 924.21, writes: 926.71, response time: 1543.45ms (95%), errors: 0.00, reconnects:  0.00
[1410s] threads: 600, tps: 2493.41, reads: 1243.81, writes: 1249.91, response time: 1124.14ms (95%), errors: 0.00, reconnects:  0.00
[1420s] threads: 600, tps: 1628.29, reads: 815.40, writes: 812.60, response time: 1302.12ms (95%), errors: 0.00, reconnects:  0.00
[1430s] threads: 600, tps: 1737.90, reads: 865.30, writes: 872.60, response time: 1128.86ms (95%), errors: 0.00, reconnects:  0.00
[1440s] threads: 600, tps: 1576.90, reads: 787.60, writes: 789.30, response time: 1375.44ms (95%), errors: 0.00, reconnects:  0.00
[1450s] threads: 600, tps: 1773.60, reads: 884.00, writes: 889.60, response time: 1374.20ms (95%), errors: 0.00, reconnects:  0.00
[1460s] threads: 600, tps: 1845.71, reads: 922.71, writes: 923.01, response time: 1252.42ms (95%), errors: 0.00, reconnects:  0.00
[1470s] threads: 600, tps: 2229.28, reads: 1111.89, writes: 1117.39, response time: 1001.47ms (95%), errors: 0.00, reconnects:  0.00
[1480s] threads: 600, tps: 2510.32, reads: 1254.31, writes: 1256.71, response time: 918.75ms (95%), errors: 0.00, reconnects:  0.00
[1490s] threads: 600, tps: 1908.09, reads: 951.79, writes: 955.59, response time: 1148.29ms (95%), errors: 0.00, reconnects:  0.00
[1500s] threads: 600, tps: 2327.93, reads: 1161.71, writes: 1166.41, response time: 1395.34ms (95%), errors: 0.00, reconnects:  0.00
[1510s] threads: 600, tps: 2329.08, reads: 1162.89, writes: 1165.99, response time: 988.08ms (95%), errors: 0.00, reconnects:  0.00
[1520s] threads: 600, tps: 2036.43, reads: 1017.81, writes: 1018.61, response time: 938.21ms (95%), errors: 0.00, reconnects:  0.00
[1530s] threads: 600, tps: 787.59, reads: 393.19, writes: 394.39, response time: 1060.72ms (95%), errors: 0.00, reconnects:  0.00
[1540s] threads: 600, tps: 0.00, reads: 0.00, writes: 0.00, response time: 0.00ms (95%), errors: 0.00, reconnects:  0.00
[2120s] threads: 600, tps: 0.00, reads: 0.00, writes: 0.00, response time: 0.00ms (95%), errors: 0.00, reconnects:  0.00
[2130s] threads: 600, tps: 0.00, reads: 0.00, writes: 0.00, response time: 0.00ms (95%), errors: 0.00, reconnects:  0.00
[2140s] threads: 600, tps: 219.00, reads: 108.30, writes: 110.70, response time: 615414.74ms (95%), errors: 0.00, reconnects:  0.00
[2150s] threads: 600, tps: 2046.80, reads: 1023.90, writes: 1022.90, response time: 1158.65ms (95%), errors: 0.00, reconnects:  0.00
[2160s] threads: 600, tps: 2560.12, reads: 1275.81, writes: 1284.31, response time: 854.55ms (95%), errors: 0.00, reconnects:  0.00
[2170s] threads: 600, tps: 3093.08, reads: 1542.49, writes: 1550.59, response time: 783.97ms (95%), errors: 0.00, reconnects:  0.00
[2180s] threads: 600, tps: 3234.00, reads: 1616.00, writes: 1618.00, response time: 698.42ms (95%), errors: 0.00, reconnects:  0.00
[2190s] threads: 600, tps: 3709.84, reads: 1851.62, writes: 1858.62, response time: 772.09ms (95%), errors: 0.00, reconnects:  0.00
[2200s] threads: 600, tps: 3492.39, reads: 1741.19, writes: 1750.79, response time: 762.67ms (95%), errors: 0.00, reconnects:  0.00
[2210s] threads: 600, tps: 3282.96, reads: 1639.88, writes: 1643.08, response time: 889.00ms (95%), errors: 0.00, reconnects:  0.00
[2220s] threads: 600, tps: 3922.43, reads: 1958.12, writes: 1964.32, response time: 690.32ms (95%), errors: 0.00, reconnects:  0.00
[2230s] threads: 600, tps: 3949.69, reads: 1972.60, writes: 1977.10, response time: 836.58ms (95%), errors: 0.00, reconnects:  0.00
[2240s] threads: 600, tps: 4091.38, reads: 2042.09, writes: 2049.29, response time: 617.39ms (95%), errors: 0.00, reconnects:  0.00
在中途會有一陣TPS為零,為什麼會出現上述的情況呢,是因為髒頁過多,MySQL 必須先將髒頁刷到磁盤才能繼續工作.
要想了解髒頁與redo log 之間的關系,請看 http://blog.csdn.net/yaoqinglin/article/details/46646267
當髒頁刷新的速度不及事務提交的速度,導致髒頁過多時,就會觸發MySQL 的保護機制,停止寫入的操作,只刷盤,直到MySQL認為OK了才好.
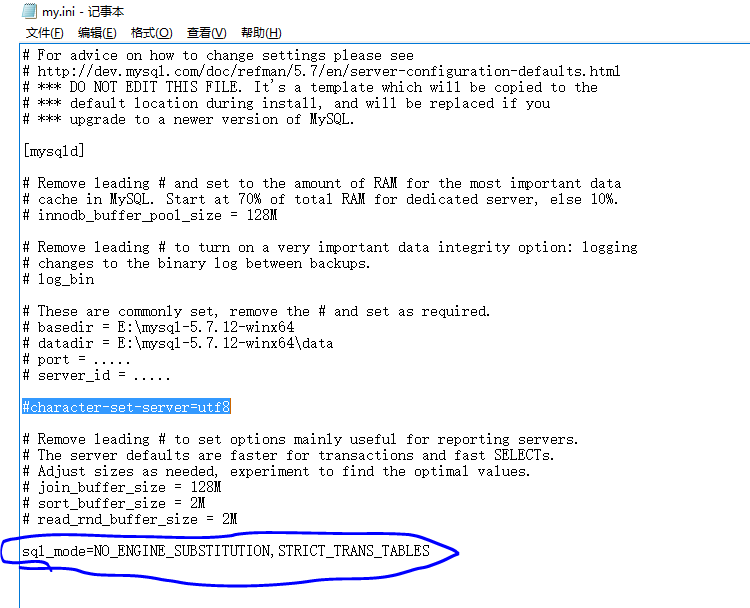
配置文件如下
innodb_log_file_size = 1000M
innodb_log_files_in_group = 4
innodb_max_dirty_pages_pct = 75
innodb_io_capacity  = 200
問題的原因找到了,那怎麼解決這個問題呢?
個人覺得應該:最為重要的是 減小 innodb_io_capacity
原理分析:
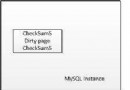
首先看下圖
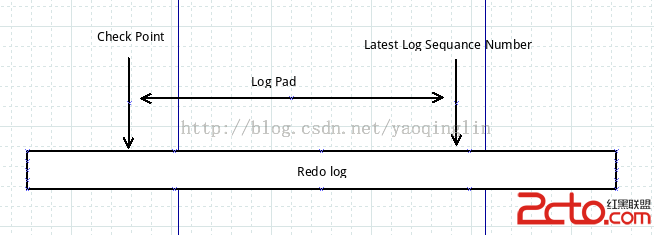
當Log Pad 占了redo log 的75%以上,MySQL會異步的將Log pad所表示的髒頁刷到磁盤中,但是此時MySQL不會停止事務的提交以及寫入redo log.
當Log Pad 占了redo log 的90%時,MySQL會停止全部的寫入操作,將Log Pad 刷新到磁盤.
造成這種情況的原因呢,自然是刷新的速度比不上事務的提交的速度.但是我們在發生問題之間的監控表示,磁盤的I/O並沒有被大量的使用,那麼MySQL為甚麼不
在發生問題之前使用磁盤I/O開始刷,以減輕發生問題時的壓力.
原因是MySQL有一種自適應的刷盤方式,控制整個刷新進程.innodb_adaptive_flushing,innodb_io_capacity, innodb_max_dirty_pages_pct, redo log 大小來判斷什麼時候
開始刷新髒頁.怎麼判斷呢,大致上MySQL 會根據innodb_io_capacity來判斷更新的速度能不能在可控的范圍內.如果innodb_io_capacity設置過大,則會造成MySQL高估了
磁盤的能力,導致髒頁堆積,就會出現本文所說的問題.如果設置過低,則會出現MySQL低估了磁盤的能力,使得數據庫能夠單位時間內提交的事務數(tps)降低.
我們的服務器的磁盤是7200rpm,屬於比較低級的磁盤,根據MySQL 官方的建議,應該將innodb_io_capacity降低到100.
[root@t1 bin]# ./sg_vpd /dev/sda --page=0xb1
Block device characteristics VPD page (SBC):
  Nominal rotation rate: 7200 rpm
  Product type: Not specified
  WABEREQ=0
  WACEREQ=0
  Nominal form factor: 3.5 inch
  HAW_ZBC=0
  FUAB=0
  VBULS=0
For systems with individual 5400 RPM or 7200 RPM drives, you might lower the value to the former default of 100.