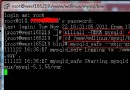
mysql監測工具tuning-primer.sh mysql的運算情況,我們可以一步一步的去查看,分析。這樣需要一定的時間,今天推薦給大家一個不錯的腳本tuning-primer.sh,可以幫助我們去查看一下msyql的運行情況,產生報告和給出一些建議,我們可以根據這些建議,結合mysql服務器的實際情況,對mysql進行優化。 下載地址: wget http://www.day32.com/MySQL/tuning-primer.sh 注意:將tuning-primer.sh放到於my.cnf同一目錄上,並賦於可讀寫權限 若出現如下錯誤
[html]
[root@mwtec-80 data]# sh tuning-primer.sh
which: no bc in (/usr/local/cmake/bin:/usr/local/mysql3306/bin:/home/hadoop/hadoop-0.20.2/bin:/usr/java/jdk1.6.0_26/bin:/usr/java/jdk1.6.0_26/jre/bin:/usr/local/sbin:/usr/local/bin:/sbin:/bin:/usr/sbin:/usr/bin:/home/hadoop/pig-0.10.1/bin:/root/bin)
Error: Command line calculator 'bc' not found!
安裝下 bc即可:
yum install bc

[root@mwtec-80 mysql3306]# ./tuning-primer.sh

        -- MYSQL PERFORMANCE TUNING PRIMER --
             - By: Matthew Montgomery -


MySQL Version 5.6.12 x86_64


Uptime = 0 days 1 hrs 55 min 50 sec
Avg. qps = 0
Total Questions = 50
Threads Connected = 1


Warning: Server has not been running for at least 48hrs.
It may not be safe to use these recommendations


To find out more information on how each of these
runtime variables effects performance visit:
http://dev.mysql.com/doc/refman/5.6/en/server-system-variables.html
Visit http://www.mysql.com/products/enterprise/advisors.html
for info about MySQL's Enterprise Monitoring and Advisory Service


SLOW QUERIES  --慢查詢情況
The slow query log is NOT enabled.
Current long_query_time = 10.000000 sec.
You have 0 out of 71 that take longer than 10.000000 sec. to complete
Your long_query_time seems to be fine


BINARY UPDATE LOG
The binary update log is NOT enabled.
You will not be able to do point in time recovery
See http://dev.mysql.com/doc/refman/5.6/en/point-in-time-recovery.html


WORKER THREADS  --工作線程
Current thread_cache_size = 9
Current threads_cached = 0
Current threads_per_sec = 0
Historic threads_per_sec = 0
Your thread_cache_size is fine


MAX CONNECTIONS  --最大連接數
Current max_connections = 151
Current threads_connected = 1
Historic max_used_connections = 1
The number of used connections is 0% of the configured maximum.
You are using less than 10% of your configured max_connections.
Lowering max_connections could help to avoid an over-allocation of memory
See "MEMORY USAGE" section to make sure you are not over-allocating


INNODB STATUS
Current InnoDB index space = 0 bytes
Current InnoDB data space = 80 K
Current InnoDB buffer pool free = 97 %
Current innodb_buffer_pool_size = 128 M
Depending on how much space your innodb indexes take up it may be safe
to increase this value to up to 2 / 3 of total system memory


MEMORY USAGE  --內存使用情況
Max Memory Ever Allocated : 154 M
Configured Max Per-thread Buffers : 169 M
Configured Max Global Buffers : 153 M
Configured Max Memory Limit : 322 M
Physical Memory : 3.61 G
Max memory limit seem to be within acceptable norms


KEY BUFFER  --myisam表的key buffer使用情況
No key reads?!
Seriously look into using some indexes
Current MyISAM index space = 108 K
Current key_buffer_size = 8 M
Key cache miss rate is 1 : 0
Key buffer free ratio = 81 %
Your key_buffer_size seems to be fine


QUERY CACHE --查詢緩存情況
Query cache is enabled
Current query_cache_size = 1 M
Current query_cache_used = 16 K
Current query_cache_limit = 1 M
Current Query cache Memory fill ratio = 1.64 %
Current query_cache_min_res_unit = 4 K
Your query_cache_size seems to be too high.
Perhaps you can use these resources elsewhere
MySQL won't cache query results that are larger than query_cache_limit in size


SORT OPERATIONS --排序情況
Current sort_buffer_size = 256 K
Current read_rnd_buffer_size = 256 K
No sort operations have been performed
Sort buffer seems to be fine


JOINS  --連接情況
Current join_buffer_size = 260.00 K
You have had 0 queries where a join could not use an index properly
Your joins seem to be using indexes properly


OPEN FILES LIMIT  --最大打開文件情況
Current open_files_limit = 5000 files
The open_files_limit should typically be set to at least 2x-3x
that of table_cache if you have heavy MyISAM usage.
Your open_files_limit value seems to be fine


TABLE CACHE --表緩存使用情況
Current table_open_cache = 2000 tables
Current table_definition_cache = 1400 tables
You have a total of 80 tables
You have 80 open tables.
The table_cache value seems to be fine


TEMP TABLES -- 臨時表使用情況
Current max_heap_table_size = 16 M
Current tmp_table_size = 16 M
Of 337 temp tables, 10% were created on disk
Created disk tmp tables ratio seems fine


TABLE SCANS -- 表掃描情況
Current read_buffer_size = 128 K
Current table scan ratio = 6 : 1
read_buffer_size seems to be fine


TABLE LOCKING --表鎖定情況
Current Lock Wait ratio = 0 : 326
Your table locking seems to be fine