mysql 的 sql 性能分析器主要用途是顯示 sql 執行的整個過程中各項資源的使用情況。分析器可以更好的展示出不良 SQL 的性能問題所在。
下面我們舉例介紹一下 MySQL SQL Profiler 的使用方法:
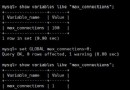
首先,開啟 MySQL SQL Profiler
mysql> SELECT @@profiling;
+-------------+
| @@profiling |
+-------------+
| 0 |
+-------------+
1 row in set (0.00 sec)
mysql> SET profiling = 1;
Query OK, 0 rows affected (0.00 sec)
mysql> SELECT @@profiling;
+-------------+
| @@profiling |
+-------------+
| 1 |
+-------------+
1 row in set (0.00 sec)
默認情況下 profiling 的值為 0 表示 MySQL SQL Profiler 處於 OFF 狀態,開啟 SQL 性能分析器後 profiling 的值為 1.
通過 sql 性能分析器,我們來對比一下 下列語句前後 2 次執行過程的差異,對我們了解 sql 的詳細執行過程是非常有幫助的。
mysql> create table t_engines select * from t_engines1;
Query OK, 57344 rows affected (0.10 sec)
Records: 57344 Duplicates: 0 Warnings: 0
mysql> select count(*) from t_engines;
+----------+
| count(*) |
+----------+
| 57344 |
+----------+
1 row in set (0.00 sec)
mysql> select count(*) from t_engines;
+----------+
| count(*) |
+----------+
| 57344 |
+----------+
1 row in set (0.00 sec)
mysql> SHOW PROFILES;
+----------+------------+-------------------------------------------------+
| Query_ID | Duration | Query |
+----------+------------+-------------------------------------------------+
| 26 | 0.10213775 | create table t_engines select * from t_engines1 |
| 27 | 0.00032775 | select count(*) from t_engines |
| 28 | 0.00003850 | select count(*) from t_engines |
+----------+------------+-------------------------------------------------+
15 rows in set (0.01 sec)
mysql> SHOW PROFILE FOR QUERY 27;
+--------------------------------+------------+
| Status | Duration |
+--------------------------------+------------+
| (initialization) | 0.00000425 |
| checking query cache for query | 0.00004050 |
| checking permissions | 0.00001050 |
| Opening tables | 0.00018250 |
| System lock | 0.00000450 |
| Table lock | 0.00001775 |
| init | 0.00001075 |
| optimizing | 0.00000550 |
| executing | 0.00002775 |
| end | 0.00000450 |
| query end | 0.00000325 |
| storing result in query cache | 0.00000400 |
| freeing items | 0.00000400 |
| closing tables | 0.00000500 |
| logging slow query | 0.00000300 |
+--------------------------------+------------+
15 rows in set (0.00 sec)
mysql> SHOW PROFILE FOR QUERY 28;
+-------------------------------------+------------+
| Status | Duration |
+-------------------------------------+------------+
| (initialization) | 0.00000350 |
| checking query cache for query | 0.00000750 |
| checking privileges on cached query | 0.00000500 |
| checking permissions | 0.00000525 |
| sending cached result to client | 0.00001275 |
| logging slow query | 0.00000450 |
+-------------------------------------+------------+
6 rows in set (0.00 sec)
mysql> SELECT sum( FORMAT(DURATION, 6)) AS DURATION FROM INFORMATION_SCHEMA.PROFILING WHERE QUERY_ID =27 ORDER BY SEQ;
+----------+
| DURATION |
+----------+
| 0.000326 |
+----------+
1 row in set (0.00 sec)
mysql> SELECT sum( FORMAT(DURATION, 6)) AS DURATION FROM INFORMATION_SCHEMA.PROFILING WHERE QUERY_ID =28 ORDER BY SEQ;
+----------+
| DURATION |
+----------+
| 0.000039 |
+----------+
1 row in set (0.00 sec)
mysql>
從上面的例子中我們可以清晰的看出 2 次執行 count 語句的差別, SHOW PROFILE FOR QUERY 27 展現的是第一次 count 統計的執行過程,包含了 Opening tables 、 Table lock 等操作 。而 SHOW PROFILE FOR QUERY 28 展示了第二次 count 統計的執行過程 , 第二次 count 直接從查詢緩存中返回 count 統計結果,通過對比 2 次統計的總執行時間發現,緩存讀的速度接近物理讀的 10 倍。通過使用 SQL 性能分析器可以幫助我們對一些比較難以確定性能問題的 SQL 進行診斷,找出問題根源。