一,獲取mysql用戶下的進程總數
ps -ef | awk '{print $1}' | grep "mysql" | grep -v "grep" | wc-1
二,主機性能狀態
# uptime
[root@ ~]# uptime
三,CPU使用率
# top
或
# vmstat
四,磁盤IO量
# vmstat 或 # iostat
五,swap進出量[內存]
# free
六,數據庫性能狀態
(1)QPS(每秒Query量)
QPS = Questions(or Queries) / seconds
mysql > show /*50000 global */ status like 'Question';
(2)TPS(每秒事務量)
TPS = (Com_commit + Com_rollback) / seconds
mysql > show status like 'Com_commit';
mysql > show status like 'Com_rollback';
(3)key Buffer 命中率
key_buffer_read_hits = (1-key_reads / key_read_requests) * 100%
key_buffer_write_hits = (1-key_writes / key_write_requests) * 100%
mysql> show status like 'Key%';
(4)InnoDB Buffer命中率
innodb_buffer_read_hits = (1 - innodb_buffer_pool_reads / innodb_buffer_pool_read_requests) * 100%
mysql> show status like 'innodb_buffer_pool_read%';
(5)Query Cache命中率
Query_cache_hits = (Qcahce_hits / (Qcache_hits + Qcache_inserts )) * 100%;
mysql> show status like 'Qcache%';
(6)Table Cache狀態量
mysql> show status like 'open%';
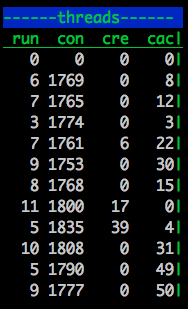
(7)Thread Cache 命中率
Thread_cache_hits = (1 - Threads_created / connections ) * 100%
mysql> show status like 'Thread%';
mysql> show status like 'Connections';
(8)鎖定狀態
mysql> show status like '%lock%';
(9)復制延時量
mysql > show slave status
(10) Tmp Table 狀況(臨時表狀況)
mysql > show status like 'Create_tmp%';
(11) Binlog Cache 使用狀況
mysql > show status like 'Binlog_cache%';
(12) Innodb_log_waits 量
mysql > show status like 'innodb_log_waits';
開源監控軟件
一,RRDTool
二,Nagios
三,MRTG
四,Cacti