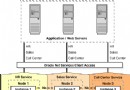
前幾天,一台Oracle數據庫(Oracle Database 10g Release 10.2.0.4.0 - 64bit Production)監控出現"PMON failed to acquire latch, see PMON dump"錯誤,連接數據庫出現短暫異常,告警日志中具體錯誤如下所示:
Tue Dec 20 09:13:16 2016
PMON failed to acquire latch, see PMON dump
Tue Dec 20 09:14:16 2016
PMON failed to acquire latch, see PMON dump
Tue Dec 20 09:15:55 2016
PMON failed to acquire latch, see PMON dump
Tue Dec 20 09:17:15 2016
PMON failed to acquire latch, see PMON dump
Tue Dec 20 09:17:24 2016
WARNING: inbound connection timed out (ORA-3136)
Tue Dec 20 09:18:23 2016
PMON failed to acquire latch, see PMON dump
Tue Dec 20 09:19:24 2016
PMON failed to acquire latch, see PMON dump
在生成的epps_pmon_4988.trc 跟蹤文件裡面,發現有些詳細信息,你會發現PMON進程不能獲取'Child shared pool' latch,它被一個pid = 19 ospid=5022的進程給阻塞了。而ospid這個進程是一個Dispatcher的進程。
*** 2016-12-20 09:14:16.575
PMON unable to acquire latch 600edfa8 Child shared pool level=7 child#=1
Location from where latch is held: kghfrunp: alloc: session dur:
Context saved from call: 0
state=busy, wlstate=free
waiters [orapid (seconds since: put on list, posted, alive check)]:
33 (3, 1482196555, 3)
10 (3, 1482196555, 3)
25 (3, 1482196555, 3)
13 (3, 1482196555, 3)
waiter count=4
gotten 861091119 times wait, failed first 7114074 sleeps 1392223
gotten 0 times nowait, failed: 0
possible holder pid = 19 ospid=5022
----------------------------------------
SO: 0x40979aec8, type: 2, owner: (nil), flag: INIT/-/-/0x00
(process) Oracle pid=19, calls cur/top: (nil)/0x409c92608, flag: (80) DISPATCHER
int error: 0, call error: 0, sess error: 0, txn error 0
(post info) last post received: 0 0 236
last post received-location: kmcpdp
last process to post me: 4097a64a0 106 64
last post sent: 0 0 229
last post sent-location: kmcmbf: not KMCVCFTOS
last process posted by me: 4097a64a0 106 64
(latch info) wait_event=0 bits=a0
holding (efd=4) 600edfa8 Child shared pool level=7 child#=1
Location from where latch is held: kghfrunp: alloc: session dur:
Context saved from call: 0
state=busy, wlstate=free
waiters [orapid (seconds since: put on list, posted, alive check)]:
33 (3, 1482196555, 3)
10 (3, 1482196555, 3)
25 (3, 1482196555, 3)
13 (3, 1482196555, 3)
waiter count=4
holding (efd=4) 3fff78210 Child library cache level=5 child#=2
Location from where latch is held: kghfrunp: clatch: wait:
Context saved from call: 0
state=busy, wlstate=free
waiters [orapid (seconds since: put on list, posted, alive check)]:
15 (3, 1482196555, 3)
17 (3, 1482196555, 3)
12 (3, 1482196555, 3)
waiter count=3
Process Group: DEFAULT, pseudo proc: 0x4098bc190
O/S info: user: oracle, term: UNKNOWN, ospid: 5022
OSD pid info: Unix process pid: 5022, image: oracle@xx.xxx.xxx.com (D007)
Short stack dump:
ksdxfstk()+32<-ksdxcb()+1547<-sspuser()+111<-__restore_rt()+0<-kghfrunp()+1506<-kghfnd()+1389<-kghalo()+587<-kmnsbm()+578<-nsb
al()+428<-nsbalc()+123<-nsdo()+17278<-nsopen()+2315<-nsanswer()+512<-kmnans()+37<-kmdahd()+385<-kmdmai()+5220<-kmmrdp()+564<-o
pirip()+1193<-opidrv()+582<-sou2o()+114<-opimai_real()+317<-main()+116<-__libc_start_main()+244<-_start()+41
Dump of memory from 0x0000000409747C68 to 0x0000000409747E70
409747C60 00000001 00000000 [........]
409747C70 FE9BEE10 00000003 0000003A 0003129B [........:.......]
409747C80 FEA7D5D0 00000003 0000003A 0003129B [........:.......]
409747C90 FE9DAD30 00000003 0000003A 0003129B [0.......:.......]
Repeat 2 times
409747CC0 FEAB01F0 00000003 0000003A 0003129B [........:.......]
409747CD0 FE9DAD30 00000003 0000003A 0003129B [0.......:.......]
409747CE0 FEA44E70 00000003 0000003A 0003129B [pN......:.......]
409747CF0 FEAA6FF0 00000003 0000003A 0003129B [.o......:.......]
409747D00 FEAB8AD0 00000003 0000003A 0003129B [........:.......]
409747D10 FEA14FF0 00000003 0000003A 0003129B [.O......:.......]
409747D20 FE9A77F0 00000003 0000003A 0003129B [.w......:.......]
Repeat 1 times
409747D40 FEA3CEB0 00000003 0000003A 0003129B [........:.......]
Repeat 1 times
409747D60 FE9C64B0 00000003 0000003A 0003129B [.d......:.......]
Repeat 1 times
409747D80 FEA062B0 00000003 0000003A 0003129B [.b......:.......]
Repeat 3 times
409747DC0 FEAA6FF0 00000003 0000003A 0003129B [.o......:.......]
409747DD0 FEA8F9D0 00000003 0000003A 0003129B [........:.......]
409747DE0 FE9F7570 00000003 0000003A 0003129B [pu......:.......]
409747DF0 FEA91530 00000003 0000003A 0003129B [0.......:.......]
409747E00 FE9BEE10 00000003 0000003A 0003129B [........:.......]
409747E10 FE9BB750 00000003 0000003A 0003129B [P.......:.......]
409747E20 FEA90C10 00000003 0000003A 0003129B [........:.......]
409747E30 FEA8B9F0 00000003 0000003A 0003129B [........:.......]
409747E40 FE9C5270 00000003 0000003A 0003129B [pR......:.......]
409747E50 FEAE12B0 00000003 0000003A 0003129B [........:.......]
409747E60 FE9C5270 00000003 0000003A 0003129B [pR......:.......]
由於當時沒有出現問題時,並沒有及時發現,沒有Collect HangAnalyze traces,所以再深入一點的挖掘root case已經很難了。當時手工生成了一個快照(9:26),也就是說9:00 ~ 9:26這段時間生成的快照剛剛覆蓋了出現問題的時間段。生成了這個時段的AWR報告,在這個時間段latch:library cache 和latch:shared pool等待事件是主要等待事件。
出現問題的時間段,數據庫服務器是比較空閒的。
生成了20-Dec-16 09:11:16到20-Dec-16 09:21:16時段的ASH報告。如下所示,latch:library cache 和latch:shared pool為主要等待事件,但是Avg Active Sessions很小。
所以覺得很有可能是跟Bug有關系,後面在Oracle MetaLink查了一下是否有相關Bug,如下一些相關資料:
Bug 7039896 Spin under kghquiesce_regular_extent holding shared pool latch with AMM
Bug 6488694 - DATABASE HUNG WITH PMON FAILED TO ACQUIRE LATCH MESSAGE
Note 7039896.8 - Bug 7039896 - Spin under kghquiesce_regular_extent holding shared pool latch with AMM
Pmon Failed To Acquire Latch" Messages in Alert Log -Database Hung (文檔 ID 468740.1)
Hang (Involving Shared Resource)
A process may hold a shared resource a lot longer than normally expected leading to many other processes having to wait for that resource. Such a resource could be a lock, a library cache pin, a latch etc.. The overall symptom is that typically numerous processes all appear to be stuck, although some processes may continue unhindered if they do not need the blocked resource.
Hang (Process Spins)
A process enters a tight CPU loop so appears to hang but is actually consuming CPU.
Latch Contention
This issue can result in latch contention within the database.
Waits for "latch: shared pool"
我們數據庫版本為Oracle Database 10g Release 10.2.0.4.0 - 64bit Production, 所以Bug 7039896是會影響的這個數據庫的, 而出現的現象也很符合,但是有一點就是並沒有涉及MMAN進程。而且查過V$SGA_RESIZE_OPS,那個時間段並沒有相關組件的增長、收縮。另外跟Bug 也非常類似,但是trc文件並沒有發現跟MMAN進程有關系。 這個問題還是第一次出現,而且出現過一次後,最近幾天都沒有出現,所以更加確信是Bug引起的。當然是要找個時間應用Bug 7039896的相關補丁。
另外,在查找這個問題的時候,在官方文檔看到一個如何處理、診斷'PMON failed to acquire latch, see PMON dump'的詳細文檔,本想收錄於此,不過還是保持為PDF文件較好,需要可從下面鏈接下載。
SRDC - How to Collect Standard Information for Issues Where 'PMON failed to acquire latch, see PMON dump' Warnings are Seen in the Alert Log (文檔 ID 1951971.1)