凌晨收到同事電話,反饋應用程序訪問Oracle數據庫時報錯,當時現場現象確認:
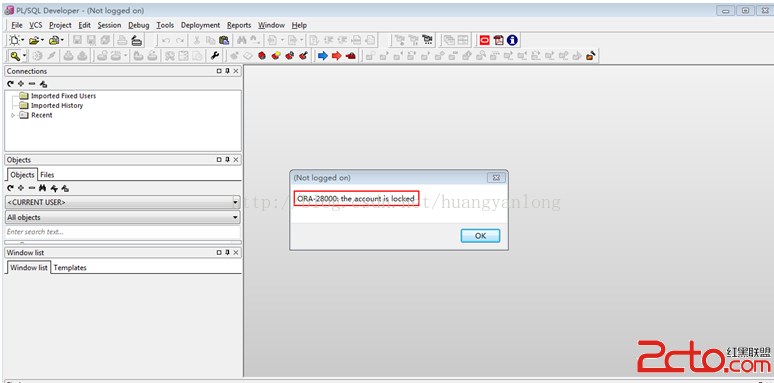
1. 應用程序訪問不了數據庫,使用SQL Developer測試發現訪問不了數據庫。報ORA-12570 TNS:packet reader failure
2. 使用lsnrctl status檢查監聽,一直沒有響應,這個是極少見的情況。
3. 檢查數據庫狀態為OPEN,使用nmon檢查系統資源。如下一張截圖所示,CPU利用率不高,但是CPU Wait%非常高。這意味著I/O不正常。可能出現了IO等待和爭用(IO waits and contention)
CPU Wait%:顯示采集間隔內所有CPU處於空閒且等待I/O完成的時間比例,Wait%是CPU空閒狀態的一種,當CPU處於空閒狀態而又有進程處於D狀態(不可中斷睡眠)時,系統會統計這時的時間,並計算到Wait%裡,Wait%不是一個時間值,而是時間的比例,因此在同樣I/O Wait時間下,服務器CPU越多,Wait%越低,它體現了I/O操作與計算操作之間的比例。對I/O密集型的應用來說一般Wait%較高.)
4.打開郵件發現收到大量的監控告警日志作業發出的郵件,檢查告警日志,發現裡面有大量ORA錯誤信息,部分內容如下:
3 | | ORA-00494: enqueue [CF] held for too long (more than 900 seconds) by 'inst 1, osid 5166'
10 | | ORA-00494: enqueue [CF] held for too long (more than 900 seconds) by 'inst 1, osid 5166'
17 | | ORA-00494: enqueue [CF] held for too long (more than 900 seconds) by 'inst 1, osid 5166'
24 | | ORA-00494: enqueue [CF] held for too long (more than 900 seconds) by 'inst 1, osid 5166'
31 | | ORA-00494: enqueue [CF] held for too long (more than 900 seconds) by 'inst 1, osid 5166'
38 | | ORA-00239: timeout waiting for control file enqueue: held by 'inst 1, osid 5166' for more than 900 seconds
41 | | ORA-00494: enqueue [CF] held for too long (more than 900 seconds) by 'inst 1, osid 5166'
48 | | ORA-00239: timeout waiting for control file enqueue: held by 'inst 1, osid 5166' for more than 900 seconds
關於“ORA-00494: enqueue [CF] held for too long (more than 900 seconds).....”這個錯誤,我們先看看這個錯誤的相關描述:
[oracle@DB-Server ~]$ oerr ora 494
00494, 00000, "enqueue %s held for too long (more than %s seconds) by 'inst %s, osid %s'"
// *Cause: The specified process did not release the enqueue within
// the maximum allowed time.
// *Action: Reissue any commands that failed and contact Oracle Support
// Services with the incident information.
出現ORA-00494 意味這Instance Crash了,可以參考官方文檔 Database Crashes With ORA-00494 (文檔 ID 753290.1):
This error can also be accompanied by ORA-600 [2103] which is basically the same problem - a process was unable to obtain the CF enqueue within the specified timeout (default 900 seconds).
This behavior can be correlated with server high load and high concurrency on resources, IO waits and contention, which keep the Oracle background processes from receiving the necessary resources.
Cause#1: The lgwr has killed the ckpt process, causing the instance to crash.
From the alert.log we can see:
The database has waited too long for a CF enqueue, so the next error is reported:
ORA-00494: enqueue [CF] held for too long (more than 900 seconds) by 'inst 1, osid 38356'
Then the LGWR killed the blocker, which was in this case the CKPT process which then causes the instance to crash.
Checking the alert.log further we can see that the frequency of redo log files switch is very high (almost every 1 min).
Cause#2: Checking the I/O State in the AWR report we find that:
Average Read per ms (Av Rd(ms)) for the database files which are located on this mount point " /oracle/oa1l/data/" is facing I/O issue as per the data collection which was perform
Cause#3: The problem has been investigated in Bug 7692631 - 'DATABASE CRASHES WITH ORA-494 AFTER UPGRADE TO 10.2.0.4'
and unpublished Bug 7914003 'KILL BLOCKER AFTER ORA-494 LEADS TO FATAL BG PROCESS BEING KILLED'
The ORA-00494 error occurs during periods of super-high stress, activity to the point there the server becomes unresponsive due to overloaded disk I/O, CPU or RAM.
從上面分析看,這三種原因都存在可能性。但是需要跟多的信息和證據來確認到底是什麼原因導致ORA-00494錯誤, 以至數據庫實例Crash。
1:告警日志裡面有“ORA-00494: enqueue [CF] held for too long (more than 900 seconds) by 'inst 1, osid 5166'” 錯誤,CF指Control file schema global enqueue。如果一個進程在指定的時間(默認900秒)內無法獲得CF鎖,則CF鎖的執行進程會被kill。這個參數為_controlfile_enqueue_timeout
SQL> COL NAME FOR A45 ;
SQL> COL VALUE FOR A32 ;
SQL> COL DESCR FOR A80 ;
SQL> SELECT x.ksppinm NAME
2 , y.ksppstvl VALUE
3 , x.ksppdesc DESCR
4 FROM SYS.x$ksppi x, SYS.x$ksppcv y
5 WHERE x.indx = y.indx
6 AND x.ksppinm LIKE '%&par%';
Enter value for par: controlfile_enqueue
old 6: AND x.ksppinm LIKE '%&par%'
new 6: AND x.ksppinm LIKE '%controlfile_enqueue%'
NAME VALUE DESCR
--------------------------------------------- -------------------------------- --------------------------------------------------------------------------------
_controlfile_enqueue_timeout 900 control file enqueue timeout in seconds
_controlfile_enqueue_holding_time 120 control file enqueue max holding time in seconds
_controlfile_enqueue_dump FALSE dump the system states after controlfile enqueue timeout
_kill_controlfile_enqueue_blocker TRUE enable killing controlfile enqueue blocker on timeout
SQL>
檢查redo log的切換頻率,發現在2016-11-09 零點到2點,以及2016-11-08 22:00~ 24:00的redo log 切換頻率都很低。排除有大量DML操作的可能性, 根據以上一些分析,我們還不能完全排除Cause#1。我們接著分析其他信息
SELECT
TO_CHAR(FIRST_TIME,'YYYY-MM-DD') DAY,
TO_CHAR(SUM(DECODE(TO_CHAR(FIRST_TIME,'HH24'),'00',1,0)),'99') "00",
TO_CHAR(SUM(DECODE(TO_CHAR(FIRST_TIME,'HH24'),'01',1,0)),'99') "01",
TO_CHAR(SUM(DECODE(TO_CHAR(FIRST_TIME,'HH24'),'02',1,0)),'99') "02",
TO_CHAR(SUM(DECODE(TO_CHAR(FIRST_TIME,'HH24'),'03',1,0)),'99') "03",
TO_CHAR(SUM(DECODE(TO_CHAR(FIRST_TIME,'HH24'),'04',1,0)),'99') "04",
TO_CHAR(SUM(DECODE(TO_CHAR(FIRST_TIME,'HH24'),'05',1,0)),'99') "05",
TO_CHAR(SUM(DECODE(TO_CHAR(FIRST_TIME,'HH24'),'06',1,0)),'99') "06",
TO_CHAR(SUM(DECODE(TO_CHAR(FIRST_TIME,'HH24'),'07',1,0)),'99') "07",
TO_CHAR(SUM(DECODE(TO_CHAR(FIRST_TIME,'HH24'),'08',1,0)),'99') "08",
TO_CHAR(SUM(DECODE(TO_CHAR(FIRST_TIME,'HH24'),'09',1,0)),'99') "09",
TO_CHAR(SUM(DECODE(TO_CHAR(FIRST_TIME,'HH24'),'10',1,0)),'99') "10",
TO_CHAR(SUM(DECODE(TO_CHAR(FIRST_TIME,'HH24'),'11',1,0)),'99') "11",
TO_CHAR(SUM(DECODE(TO_CHAR(FIRST_TIME,'HH24'),'12',1,0)),'99') "12",
TO_CHAR(SUM(DECODE(TO_CHAR(FIRST_TIME,'HH24'),'13',1,0)),'99') "13",
TO_CHAR(SUM(DECODE(TO_CHAR(FIRST_TIME,'HH24'),'14',1,0)),'99') "14",
TO_CHAR(SUM(DECODE(TO_CHAR(FIRST_TIME,'HH24'),'15',1,0)),'99') "15",
TO_CHAR(SUM(DECODE(TO_CHAR(FIRST_TIME,'HH24'),'16',1,0)),'99') "16",
TO_CHAR(SUM(DECODE(TO_CHAR(FIRST_TIME,'HH24'),'17',1,0)),'99') "17",
TO_CHAR(SUM(DECODE(TO_CHAR(FIRST_TIME,'HH24'),'18',1,0)),'99') "18",
TO_CHAR(SUM(DECODE(TO_CHAR(FIRST_TIME,'HH24'),'19',1,0)),'99') "19",
TO_CHAR(SUM(DECODE(TO_CHAR(FIRST_TIME,'HH24'),'20',1,0)),'99') "20",
TO_CHAR(SUM(DECODE(TO_CHAR(FIRST_TIME,'HH24'),'21',1,0)),'99') "21",
TO_CHAR(SUM(DECODE(TO_CHAR(FIRST_TIME,'HH24'),'22',1,0)),'99') "22",
TO_CHAR(SUM(DECODE(TO_CHAR(FIRST_TIME,'HH24'),'23',1,0)),'99') "23"
FROM
V$LOG_HISTORY
GROUP BY
TO_CHAR(FIRST_TIME,'YYYY-MM-DD')
ORDER BY 1 DESC;
2:關於 The problem has been investigated in Bug 7692631 - 'DATABASE CRASHES WITH ORA-494 AFTER UPGRADE TO 10.2.0.4'
and unpublished Bug 7914003 'KILL BLOCKER AFTER ORA-494 LEADS TO FATAL BG PROCESS BEING KILLED'
告警日志裡面出現ORA-00239,但是沒有出現ORA-603、ORA-00470之類的錯誤。按照官方文檔Disk I/O Contention/Slow Can Lead to ORA-239 and Instance Crash (文檔 ID 1068799.1)
I/O contention or slowness leads to control file enqueue timeout.
One particular situation that can be seen is LGWR timeout while waiting for control file enqueue, and the blocker is CKPT :
From the AWR:
1) high "log file parallel write" and "control file sequential read" waits
2) Very slow Tablespace I/O, Av Rd(ms) of 1000-4000 ms (when lower than 20 ms is acceptable)
3) very high %iowait : 98.57%.
4) confirmed IO peak during that time
Please note: Remote archive destination is also a possible cause. Networking issues can also cause this type of issue when a remote archive destination is in use for a standby database.
這台服務器已經正常運行了很多年,所以我們更傾向是IO問題導致。結合當時CPU Wait%非常高。這意味著可能出現了嚴重的IO等待和爭用(IO waits and contention)
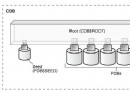
3:我們來看看監控工具OSWather生成這段時間的一些報告,如下,CPU資源非常空閒
Operating System CPU Utilization
CPU等待IO資源(Wait IO)也是從10:45 PM(22:45)之後變大。CPU利用率一直不高,最多20%多的樣子。
Operating System CPU Other
然後,我們看看Operating System I/O吧,如下截圖所示,可以看出在11點開始,系統IO設備非常繁忙 由此我們可以判斷IO異常導致數據庫出現ORA-00494錯誤的可能性很大。
Operating System I/O
Operating System I/O Throughput
然後我們檢查一下操作系統的日志,如下所示:
如下截圖所示,“INFO: task kjournald:xxx blocked for more than 120 seconds.”從23:22開始,在這之前,出現大量這類日志信息。這個是因為PlateSpin的作業復制導致(後面確認該作業在22:40啟動)。所以至此,我們更傾向是因為第二個源於引起數據庫Instance Crash。後面和系統管理員確認,PlateSpin的復制作業也是失敗了。所以種種分析,非常懷疑是PlateSpin的作業引起了IO異常。而IO發生短暫或長時間停止響應的時候,就導致數據庫實例崩潰。
後續處理解決
此時使用shutdown immediate關閉不了數據庫,沒有任何響應。只能shutdown abort,然後啟動數據庫實例,但是在startup時出現異常,報下面一些錯誤
ORA-01102: cannot mount database in EXCLUSIVE mode
ORA-00205: error in identifying control file, check alert log for more info
ORA-00202: control file: '/u01/app/oracle/oradata/epps/control01.ctl'
ORA-27086: unable to lock file - already in use
關於這個錯誤,此處不做展開,可以參考ORA-01102: cannot mount database in EXCLUSIVE mode,kill掉大部分進程後,發現有三個進程使用kill -9 kill不掉,如下截圖所示:
kill -9發送SIGKILL信號將其終止,但是以下兩種情況不起作用:
a、該進程處於”Zombie”狀態(使用ps命令返回defunct的進程)。此時進程已經釋放所有資源,但還未得到其父進程的確認。”Zombie”進程要等到下次重啟時才會消失,但它的存在不會影響系統性能。
b、 該進程處於”kernel mode”(核心態)且在等待不可獲得的資源。處於核心態的進程忽略所有信號處理,因此對於這些一直處於核心態的進程只能通過重啟系統實現。進程在Linux中會處於兩種狀態,即用戶態和核心態。只有處於用戶態的進程才可以用“kill”命令將其終止。
由於這些進程已經陷入核心態,而且很難自動喚醒,又不接受信號指令。不得已只能reboot系統了。 重啟後問題解決。後面和系統管理員協商暫時停用PlateSpin作業,待周日重新做一個完整備份後,繼續觀察IO影響。