在ORACLE數據庫中有物理讀(Physical Reads)、邏輯讀(Logical Reads)、一致性讀(Consistant Get)、當前模式讀(DB Block Gets)等諸多概念,如果不理解或混淆這些概念的話,對你深入理解一些知識無疑是一個障礙,但是這些概念確實挺讓讓人犯暈的。下面我們總結、學習一下這方面的知識點。捋一捋他們的關系和特點,希望對你有所幫助。
物理讀(Physical Reads)
從磁盤讀取數據塊到內存的操作叫物理讀,當SGA裡的高速緩存(Cache Buffer)裡面不存在這些數據塊時,就會產生物理讀,另外。像全表掃描、磁盤排序等操作也可能產生物理讀,原因也是因為ORACLE數據庫需要訪問的數據塊較多,而有些數據塊不在內存當中,需要從磁盤讀取。
邏輯讀(Logical Reads)
概念1:邏輯讀指ORACLE從內存讀到的數據塊數量。一般來說, logical reads = db block gets + consistent gets
概念2:邏輯讀指的就是從Buffer Cache中讀取數據塊。按照訪問數據塊的模式不同,可以分為當前模式讀(Current Read)和一致性讀(Consistent Read)。
這兩個概念本質是一樣的,只是措辭不一樣。
一致性讀(Consistant Get)
ORACLE是一個多用戶系統。當一個會話開始讀取數據還未結束讀取之前,可能會有其他會話修改了它將要讀取的數據。如果會話讀取到修改後的數據,就會造成數據的不一致。一致性讀就是為了保證數據的一致性。在Buffer Cache中的數據塊上都會有最後一次修改數據塊時的SCN。如果一個事務需要修改數據塊中數據,會先在回滾段中保存一份修改前數據和SCN的數據塊,然後再更新Buffer Cache中的數據塊的數據及其SCN,並標識其為“髒”數據。當其他進程讀取數據塊時,會先比較數據塊上的SCN和進程自己的SCN。如果數據塊上的SCN小於等於進程本身的SCN,則直接讀取數據塊上的數據;如果數據塊上的SCN大於進程本身的SCN,則會從回滾段中找出修改前的數據塊讀取數據。通常,普通查詢都是一致性讀。
當前模式讀(DB Block Gets)
個人覺得當前模式讀(db block gets)是最難理解的一個概念,通常情況下db block gets 可以理解為是DML操作才會產生的.
當前模式讀(db block gets)即讀取數據塊是當前的最新數據。任何時候在Buffer Cache中都只有一份當前數據塊。當前讀通常發生在對數據進行修改、刪除操作時。這時,進程會給數據加上行級鎖,並且標識數據為“髒”數據。current mode產生db block gets,一般在DML操作時產生,query mode產生consistent gets(一致性讀),一般在查詢時產生。他們兩個總和一般稱為邏輯讀,logical read。
有個有意思的現象,在ask tom或一些資料中,你會發現Oracle 8i在SELECT查詢當中還能看到db block gets,但是ORACLE 10以及以上版本在SELECT語句中db block gets一般為0。
了解完了概念,如果你還是有一些疑問和不解,那我們結合實際例子來理解一下這些概念吧。如下所示:
SQL> show user;
USER is "SYS"
SQL> create table test
2 as
3 select * from dba_objects;
Table created.
SQL> alter session set sql_trace=true;
System altered.
SQL> set autotrace on;
SQL> select object_type, count(1) from test
2 group by object_type;
OBJECT_TYPE COUNT(1)
------------------- ----------
EDITION 1
INDEX PARTITION 264
CONSUMER GROUP 25
SEQUENCE 223
TABLE PARTITION 240
SCHEDULE 3
QUEUE 35
RULE 1
JAVA DATA 328
...............................
...............................
43 rows selected.
Execution Plan
----------------------------------------------------------
Plan hash value: 1435881708
---------------------------------------------------------------------------
| Id | Operation | Name | Rows | Bytes | Cost (%CPU)| Time |
---------------------------------------------------------------------------
| 0 | SELECT STATEMENT | | 75101 | 806K| 284 (2)| 00:00:04 |
| 1 | HASH GROUP BY | | 75101 | 806K| 284 (2)| 00:00:04 |
| 2 | TABLE ACCESS FULL| TEST | 75101 | 806K| 281 (1)| 00:00:04 |
---------------------------------------------------------------------------
Note
-----
- dynamic sampling used for this statement (level=2)
Statistics
----------------------------------------------------------
48 recursive calls
0 db block gets
1109 consistent gets
1029 physical reads
0 redo size
1694 bytes sent via SQL*Net to client
545 bytes received via SQL*Net from client
4 SQL*Net roundtrips to/from client
0 sorts (memory)
0 sorts (disk)
43 rows processed
SQL> select object_type, count(1) from test
2 group by object_type;
OBJECT_TYPE COUNT(1)
------------------- ----------
EDITION 1
INDEX PARTITION 264
CONSUMER GROUP 25
SEQUENCE 223
TABLE PARTITION 240
..............................
..............................
43 rows selected.
Execution Plan
----------------------------------------------------------
Plan hash value: 1435881708
---------------------------------------------------------------------------
| Id | Operation | Name | Rows | Bytes | Cost (%CPU)| Time |
---------------------------------------------------------------------------
| 0 | SELECT STATEMENT | | 75101 | 806K| 284 (2)| 00:00:04 |
| 1 | HASH GROUP BY | | 75101 | 806K| 284 (2)| 00:00:04 |
| 2 | TABLE ACCESS FULL| TEST | 75101 | 806K| 281 (1)| 00:00:04 |
---------------------------------------------------------------------------
Note
-----
- dynamic sampling used for this statement (level=2)
Statistics
----------------------------------------------------------
0 recursive calls
0 db block gets
1034 consistent gets
0 physical reads
0 redo size
1694 bytes sent via SQL*Net to client
545 bytes received via SQL*Net from client
4 SQL*Net roundtrips to/from client
0 sorts (memory)
0 sorts (disk)
43 rows processed
SQL> set autotrace off
SQL> alter session set sql_trace =false;
Session altered.
SQL> SELECT T.value
2 || '/'
3 || Lower(Rtrim(I.INSTANCE, Chr(0)))
4 || '_ora_'
5 || P.spid
6 || '.trc' TRACE_FILE_NAME
7 FROM (SELECT P.spid
8 FROM v$mystat M,
9 v$session S,
10 v$process P
11 WHERE M.statistic# = 1
12 AND S.sid = M.sid
13 AND P.addr = S.paddr) P,
14 (SELECT T.INSTANCE
15 FROM v$thread T,
16 v$parameter V
17 WHERE V.name = 'thread'
18 AND ( V.value = 0
19 OR T.thread# = To_number(V.value) )) I,
20 (SELECT value
21 FROM v$parameter
22 WHERE name = 'user_dump_dest') T;
TRACE_FILE_NAME
--------------------------------------------------------------------------------
/u01/app/oracle/diag/rdbms/gsp/gsp/trace/gsp_ora_24900.trc
如上截圖所示, SQL語句第一次執行時,一致性讀(consistent gets)為1109, 物理讀(physical reads)為1029,當前模式讀(db block gets)為0. 如果你再執行一次上面SQL語句,你會發現物理讀(physical reads)會降低為0了,因為上一次查詢,ORACLE已經將表test的所有數據塊讀取到buffer cache裡面了。當然生產環境實際情況會復雜很多。
我們先用tkprof工具格式化一下trace文件,然後我們分析一下 out_24900.prf文件。
[oracle@DB-Server trace]$ tkprof gsp_ora_24900.trc out_24900.prf aggregate=no;
TKPROF: Release 11.2.0.1.0 - Development on Thu Sep 22 10:12:15 2016
Copyright (c) 1982, 2009, Oracle and/or its affiliates. All rights reserved.
在分析之前,我們先了解一下一些概念、術語
count = number of times OCI procedure was executed
cpu = cpu time in seconds executing
elapsed = elapsed time in seconds executing
disk = number of physical reads of buffers from disk # 物理讀
query = number of buffers gotten for consistent read # 一致性讀
current = number of buffers gotten in current mode (usually for update) # 當前模式讀
rows = number of rows processed by the fetch or execute call
call:每次SQL語句的處理都分成三個部分
Parse:這步包括語法檢查和語義檢查(包括檢查是否有正確的授權和所需要用到的表、列以及其他引用到的對象是否存在)、以及將SQL語句轉換、生成執行計劃等。
Execute:這步是真正的由ORACLE來執行語句。對於insert、update、delete操作,這步會修改數據,對於select操作,這步就只是確定選擇的記錄。
Fetch:返回查詢語句中所獲得的記錄,這步只有select語句會被執行。
count : 這個語句被parse、execute、fetch的次數。
cpu :這個語句對於所有的parse、execute、fetch所消耗的cpu的時間,以秒為單位。
elapsed :這個語句所有消耗在parse、execute、fetch的總的時間。
disk :從磁盤上的數據文件中物理讀取的數據塊的數量。
query :在一致性讀模式下,一致性讀的數量。
current :在current模式下,即當前模式讀下db blocks gets的數量。
rows : 所有SQL語句返回的記錄數目,但是不包括子查詢中返回的記錄數目。對於select語句,返回記錄是在fetch這步,對於insert、update、delete操作,返回記錄則是在execute這步。
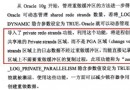
如下截圖所示(圖1與圖2本是連接在一起的,由於太長,分開截圖,兩張圖片有相同部分),由於我們實驗過程中,並沒有采集統計信息,你會看到trac文件裡面有一個動態采樣(如果你在創建表,做一次統計信息收集,結果會有一些差別),另外,物理讀和一致性讀如下,跟上面的執行計劃中的數據一致。
disk(物理讀) = 747+282 = 1029
query(一致性讀) = 1035+74 = 1109
繼續分析格式化的prf文件,我們會看到第二次查詢的query(一致性讀)為1034, disk(物理讀)為0
上面例子,讓我們了解了物理讀、一致性讀,那麼接下來看看當前模式讀(db block gets)的例子
SQL> create table t
2 ( id number(10)
3 );
Table created.
SQL> set autotrace on;
SQL> insert into t
2 values(1000);
1 row created.
Execution Plan
----------------------------------------------------------
---------------------------------------------------------------------------------
| Id | Operation | Name | Rows | Bytes | Cost (%CPU)| Time |
---------------------------------------------------------------------------------
| 0 | INSERT STATEMENT | | 1 | 100 | 1 (0)| 00:00:01 |
| 1 | LOAD TABLE CONVENTIONAL | T | | | | |
---------------------------------------------------------------------------------
Statistics
----------------------------------------------------------
1 recursive calls
7 db block gets
1 consistent gets
0 physical reads
748 redo size
836 bytes sent via SQL*Net to client
783 bytes received via SQL*Net from client
3 SQL*Net roundtrips to/from client
1 sorts (memory)
0 sorts (disk)
1 rows processed
SQL> insert into t
2 values(1001);
1 row created.
Execution Plan
----------------------------------------------------------
---------------------------------------------------------------------------------
| Id | Operation | Name | Rows | Bytes | Cost (%CPU)| Time |
---------------------------------------------------------------------------------
| 0 | INSERT STATEMENT | | 1 | 100 | 1 (0)| 00:00:01 |
| 1 | LOAD TABLE CONVENTIONAL | T | | | | |
---------------------------------------------------------------------------------
Statistics
----------------------------------------------------------
1 recursive calls
1 db block gets
1 consistent gets
0 physical reads
308 redo size
837 bytes sent via SQL*Net to client
783 bytes received via SQL*Net from client
3 SQL*Net roundtrips to/from client
1 sorts (memory)
0 sorts (disk)
1 rows processed
一致性讀如何計算呢?
關於一致性讀如何計算呢? 我查了一下資料,一般一致性讀consistent gets ~= numrows/arraysize + blocks ,確切的說是consistent reads計算 ~=ceil(獲取行數(card)/arraysize)+used blocks, 而且這個不是絕對等於,而是約等於的關系。 但是這個不是官方資料,而是asktom和一些技術博客的介紹,我們來驗證看看吧
SQL> exec dbms_stats.gather_table_stats(user, 'TEST');
PL/SQL procedure successfully completed.
SQL>
SQL> set autotrace traceonly stat
SQL> select * from test;
72271 rows selected.
Statistics
----------------------------------------------------------
448 recursive calls
0 db block gets
5846 consistent gets
1031 physical reads
0 redo size
8296071 bytes sent via SQL*Net to client
53521 bytes received via SQL*Net from client
4820 SQL*Net roundtrips to/from client
3 sorts (memory)
0 sorts (disk)
72271 rows processed
SQL> /
72271 rows selected.
Statistics
----------------------------------------------------------
0 recursive calls
0 db block gets
5789 consistent gets
0 physical reads
0 redo size
8296071 bytes sent via SQL*Net to client
53521 bytes received via SQL*Net from client
4820 SQL*Net roundtrips to/from client
0 sorts (memory)
0 sorts (disk)
72271 rows processed
SQL> set autotrace off;
SQL> set serveroutput on;
SQL> exec show_space('TEST',USER);Free Blocks............................. 0
Total Blocks............................ 1,152
Total Bytes............................. 9,437,184
Total MBytes............................ 9
Unused Blocks........................... 121
Unused Bytes............................ 991,232
Last Used Ext FileId.................... 1
Last Used Ext BlockId................... 89,344
Last Used Block......................... 7
PL/SQL procedure successfully completed.
SQL> show arraysize ;
arraysize 15
SQL> select ceil(72271/15) + 1152-121 from dual;
CEIL(72271/15)+1152-121
-----------------------
5850
SQL> SELECT COUNT(DISTINCT dbms_rowid.rowid_block_number(ROWID)) AS blocks FROM TEST;
BLOCKS
----------
1030
SQL> SELECT ceil(72271/15) + 1030 FROM DUAL;
CEIL(72271/15)+1030
-------------------
5849
不管是5849還是5850,都和5879 或5846有一點的出入?也就是說上面那個公式不能用等於號,關於這個,其實在https://asktom.oracle.com/pls/asktom/f?p=100:11:0::::P11_QUESTION_ID:880343948514 裡面,你會看到這裡介紹的也是一個約等於關系,而不是一個絕對等於的關系。在這裡我想深入一點,無奈知識有限。 從上面的公式, 我們可以看到一致性讀跟arraysize的關系是蠻大的。那麼我們來測試驗證一下,先將araraysize調整為50
SQL> set autotrace off;
SQL> set arraysize 50
SQL> set autotrace traceonly stat;
SQL> select * from test;
72271 rows selected.
Statistics
----------------------------------------------------------
0 recursive calls
0 db block gets
2456 consistent gets
0 physical reads
0 redo size
7668743 bytes sent via SQL*Net to client
16418 bytes received via SQL*Net from client
1447 SQL*Net roundtrips to/from client
0 sorts (memory)
0 sorts (disk)
72271 rows processed
SQL>
SQL> SELECT ceil(72271/50) + 1030 FROM DUAL;
CEIL(72271/50)+1030
-------------------
2476
SQL>
如上所示,一致性讀從5789降為了2456,有興趣的可以做一下實驗。另外,由於在Oracle中,取數據最後都是從buffer cache中取,所以每出現一個physical reads必然會出現一次 logical reads. 也就是說物理讀(physical reads)一定小於邏輯讀(logical reads=db block gets + consistent gets),也就是說物理讀一定小於一致性讀,但是也有物理讀大於邏輯讀的情況,具體參考官方文檔 Why Physical Read is greater than Logical Read in Tkprof (文檔 ID 211700.1)
PURPOSE
In some circumstances, you can find that tkprof report shows more physical reads than logical reads, which isn't the current result as the physical reads are normally included in logical reads.
SCOPE & APPLICATION
This article will be useful for the DBA's and customers who are concerned by the tuning of Requests.
Why Physical reads are greater than Logical reads
Sometimes, you can find the following content in tkprof report:
· Physical Reads = Disk (total)
· Logical Reads = Query (total) + Current (total)
call
count
cpu
elapsed
disk
query
current
rows
-------
------
--------
----------
----------
----------
----------
----------
Parse
1
0.67
1.10
0
0
0
0
Execute
1
0.00
0.00
0
0
0
0
Fetch
2202
167.48
678.70
579441
283473
17418
33014
-------
------
--------
----------
----------
----------
----------
----------
total
2204
168.15
679.81
579441
283473
17418
33014
The 'disk' column is then greater than the 'query' + 'current' columns. This isn't usual.
To find the root cause of the problem, you must generate a 10046 event trace file level 8 and check for direct read waits in it.
In 10046 raw trace, you will find "direct path read" and "direct path write" waits like the example below:
WAIT #1: nam='direct path read' ela= 10076 p1=4 p2=29035 p3=1
with P1 = file#, P2 = start block#, P3 = num blocks
The "direct path read" waits account explains the difference between logical and physical reads.
In Oracle 9.2 and above, TKProf will print waits associated with each SQL statement in the output file.
Explanation:
The reason for more physical reads than logical reads is due to the number of direct reads block access. Direct path reads are generally used by Oracle when reading directly into PGA memory (as opposed to into the buffer cache).
They may happen on different actions:
· Sort IO on disk.
· Read by parallel Query Slaves when scanning is done.
· Blocks read by anticipation (readahead).
Such reads are done without loading blocks into the Buffer Cache. They can be single or multiblock reads.
Utilizing Direct Path Reads in this manner prevents the Oracle Buffer cache from beeing overloaded.
Oracle uses this optimisation when it considers that its not necessary to share the blocks between different sessions.
最後我們來看一個,熱表上一致性讀飙漲的案例,其實這個是Oracle 9i&10g編程藝術:深入數據庫體系結構這本書籍裡面的一個案例,我們在此重演一遍,希望能加深大家對一致性讀的理解,首先准備測試數據環境
SQL> show user;
USER is "TEST"
SQL> create table t( x int);
Table created.
SQL> insert into t values(1);
1 row created.
SQL> commit;
Commit complete.
SQL> exec dbms_stats.gather_table_stats(user, 'T');
PL/SQL procedure successfully completed.
SQL> set autotrace on statistics;
SQL> select * from t;
X
----------
1
Statistics
----------------------------------------------------------
0 recursive calls
0 db block gets
7 consistent gets
0 physical reads
0 redo size
523 bytes sent via SQL*Net to client
523 bytes received via SQL*Net from client
2 SQL*Net roundtrips to/from client
0 sorts (memory)
0 sorts (disk)
1 rows processed
SQL>
如上所示,一般情況下一致性讀為7,但是我們在一個會話窗口准備執行下面SQL,頻繁修改表T
SQL> begin
2 for i in 1 .. 100000
3 loop
4 update t set x=x+1;
5 commit;
6 end loop;
7 end;
8 /
PL/SQL procedure successfully completed.
在上面會話執行的同時,我們在另外一個會話窗口馬上執行下面SQL,你會看到一致性讀飙漲。
SQL> alter session set isolation_level=serializable;
Session altered.
SQL> set autotrace on statistics;
SQL> select * from t;
X
----------
1
Statistics
----------------------------------------------------------
1 recursive calls
0 db block gets
23681 consistent gets
0 physical reads
0 redo size
523 bytes sent via SQL*Net to client
523 bytes received via SQL*Net from client
2 SQL*Net roundtrips to/from client
0 sorts (memory)
0 sorts (disk)
1 rows processed
將會話設置為使用SERIALIZABLE 隔離級別,這樣無論在會話中運行多少次查詢,都將得到事務開始時刻的查詢結果。具體分析不在此畫蛇添足,大家感興趣的可以去看看Oracle 9i&10g編程藝術:深入數據庫體系結構。
參考資料:
https://docs.oracle.com/cd/B19306_01/server.102/b14220/consist.htm#i13945
https://asktom.oracle.com/pls/asktom/f?p=100:11:0::::P11_QUESTION_ID:880343948514
Oracle 9i&10g編程藝術:深入數據庫體系結構