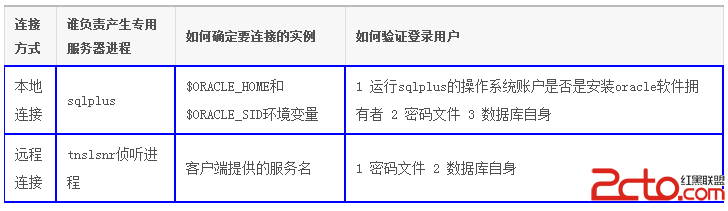
OracleMysql統計信息
我們知道Oracle的統計信息將嚴重影響CBO對執行計劃的選擇,針對不同大小的表制定收集規則並且定期執行是非常重要的。Oracle通過如下腳本即可收集統計信息:
BEGIN
  DBMS_STATS.GATHER_TABLE_STATS(ownname          =>'ZBDBA',
                                tabname          =>'TEST',
                                estimate_percent =>30,
                                method_opt       =>'for all columns size repeat',
                                no_invalidate    =>FALSE,
                                degree           =>8,
                                cascade          =>TRUE);
END;
/
這裡特別需要注意method_opt參數。Oracle官方性能優化博客專門對此參數進行了講解。有興趣的同學可以去看看,不然容易掉坑。
這裡再貼一個自動化收集腳本
DECLARE
  CURSOR STALE_TABLE IS
    SELECT OWNER,
           SEGMENT_NAME,
           CASE
             WHEN SIZE_GB < 0.5 THEN
              30
             WHEN SIZE_GB >= 0.5 AND SIZE_GB < 1 THEN
              20
             WHEN SIZE_GB >= 1 AND SIZE_GB < 5 THEN
              10
             WHEN SIZE_GB >= 5 AND SIZE_GB < 10 THEN
              5
             WHEN SIZE_GB >= 10 THEN
              1
           END AS PERCENT,
           8 AS DEGREE
      FROM (SELECT OWNER,
                   SEGMENT_NAME,
                   SUM(BYTES / 1024 / 1024 / 1024) SIZE_GB
              FROM DBA_SEGMENTS
             WHERE OWNER = 'SCOTT'
               AND SEGMENT_NAME IN
                   (SELECT /*+ UNNEST */ DISTINCT TABLE_NAME
                      FROM DBA_TAB_STATISTICS
                     WHERE (LAST_ANALYZED IS NULL OR STALE_STATS = 'YES')
                       AND OWNER = 'SCOTT')
             GROUP BY OWNER, SEGMENT_NAME);
BEGIN
  DBMS_STATS.FLUSH_DATABASE_MONITORING_INFO;
  FOR STALE IN STALE_TABLE LOOP
    DBMS_STATS.GATHER_TABLE_STATS(OWNNAME         => STALE.OWNER,
                                  TABNAME          => STALE.SEGMENT_NAME,
                                  ESTIMATE_PERCENT => STALE.PERCENT,
                                  METHOD_OPT       => 'for all columns size repeat',
                                  DEGREE           => 8,
                                  GRANULARITY      => 'ALL',
                                  CASCADE          => TRUE);
  END LOOP;
END;
/
好了,扯太遠,看看mysql的統計信息。引用percona官方博客的一段話:
An InnoDB table statistics is used for JOIN optimizations and helping the MySQL optimizer choose the appropriate index for a query. If a table’s statistics or index cardinality becomes outdated, you might see queries which previously performed well suddenly show up on slow query log until InnoDB again updates the statistics. But when does InnoDB perform the updates aside from the first opening of the table or manually running ANALYZE TABLE on it? The 2 instances below are documented from the MySQL and InnoDB plugin’s manual:
Metadata commands like SHOW INDEX, SHOW TABLE STATUS and SHOW [FULL] TABLES (or their corresponding queries from INFORMATION_SCHEMA.TABLES and INFORMATION_SCHEMA.STATISTICS)
When 1 / 16th of the table or 2Billion rows has been modified, whichever comes first. ./row/row0mysql.c:row_update_statistics_if_needed
If you or an application constantly executes SHOW [FULL] TABLES or SHOW TABLE STATUS on many a large tables, this can affect your server especially if the random index dives had to be read from disk. Here is an example of SHOW TABLE STATUS FROM schema taking away a couple of seconds on execution time.
# Time: 110923 1:48:17
# User@Host: user1[user1] @ [172.20.6.1]
# Thread_id: 10140441 Schema: db1 Last_errno: 0 Killed: 0
# Query_time: 12.277786 Lock_time: 0.000068 Rows_sent: 294 Rows_examined: 294 Rows_affected: 0 Rows_read: 294
# Bytes_sent: 34187 Tmp_tables: 1 Tmp_disk_tables: 0 Tmp_table_sizes: 0
SET timestamp=1316767697;
show table status from `db1`;
As you can see db1 has about 294 tables and it took the server 12 seconds to update all the tables’ statistics. Luckily, this can be controlled with Percona Server with the variable innodb_stats_auto_update (from MySQL Community 5.1.17 a similar variable exist called innodb_stats_on_metadata, for Percona Server where both variables exist, both should be 0 if you want to disable the feature). When set to 0, automatic updates to the table statistics (items 1 and 2 above) is disabled unless ANALYZE TABLE is ran or during first open of the table.
On my next post, I will discuss the effects of disabling the feature and how you or your application should compensate.
通過上述描述,mysql不需要我們手動的去收集統計信息。通過一些列的命令將會自動觸發統計信息的收集。innodb_stats_on_metadata參數用來控制此行為,設置為false時不更新統計信息