Oracle通過AWR的SQL ordered by Gets和SQL ordered by Reads診斷問題
之前看過很多數據庫報告,直到最近出現過兩次嚴重的性能問題,非常有代表性,所以記錄下來。
一次是報Oracle進程把數據庫服務器的CPU弄到100%
SQL ordered by Gets 是在內存中取數據,單位是次,是消耗CPU的主要源頭,在調試SQL的時候,大部分時候都是通過它來衡量性能。下面是實際的AWR報告,相當駭人啊:
SQL ordered by Gets
- Resources reported for PL/SQL code includes the resources used by all SQL statements called by the code.
- Total Buffer Gets: ###############
- Captured SQL account for 5.0% of Total
|
Buffer Gets |
Executions |
Gets per Exec |
%Total |
CPU Time (s) |
Elapsed Time (s) |
SQL Id |
SQL Module |
SQL Text |
1,606,380,390
84
19,123,576.07
-0.84
37923.62
207407.54
78tpfukr4m00p
JDBC Thin Client
select sum(temp.MidUser) total...
1,479,957,445
0
-0.77
26647.48
43778.62
2mxgaus0t6pxz
JDBC Thin Client
SELECT 設備ID SBID, 設備ID SBBM, 設...
1,280,365,092
73
17,539,247.84
-0.67
30263.02
159789.71
2qrj96dwj2xx1
JDBC Thin Client
select sum(temp.MidUser) total...
1,163,229,240
518
2,245,616.29
-0.61
11775.72
30158.95
cq0adyp396538
JDBC Thin Client
SELECT COUNT(*) FROM DM_FL_OBJ...
465,618,308
261
1,783,978.19
-0.24
11004.49
27015.23
acqqmk9b7vc4a
JDBC Thin Client
SELECT COUNT(*) FROM DM_FL_OBJ...
448,728,301
21
21,368,014.33
-0.23
10698.43
43934.26
24gvfb62gt1yd
JDBC Thin Client
select sum(temp.MidUser) total...
386,047,329
24
16,085,305.38
-0.20
9286.27
45034.84
fx8tp01tpwgkq
JDBC Thin Client
select sum(temp.MidUser) total...
294,571,906
13
22,659,377.38
-0.15
7002.73
26477.59
383ut78zg00hq
JDBC Thin Client
select sum(temp.MidUser) total...
274,341,527
14
19,595,823.36
-0.14
6415.83
26625.21
cqhbuuz14x7gh
JDBC Thin Client
select sum(temp.MidUser) total...
176,633,305
10
17,663,330.50
-0.09
4160.82
26360.28
9xc9701y82st9
JDBC Thin Client
select sum(temp.MidUser) total...
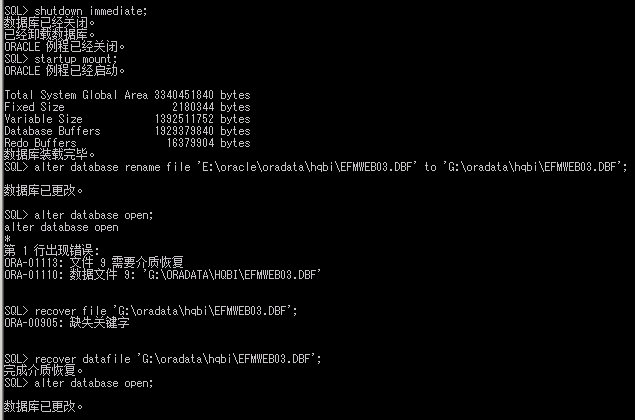
解決方案:調優SQL
一次是數據庫服務器IO負載已經達到極限
SQL ordered by Reads 去磁盤取數據,單位是次,如果太大,IO會導致整個數據庫慢,是RAC的環境,可能會導致數據庫重啟。
在數據庫top5的等待事件中,可以看到direct path read非常大。
Oracle 11g中_small_table_threshold參數是大表的界定,當表大小小於這個值時,就會對表進行緩存。它的值在實例啟動時動態決定,一般為 2% * DB_CACHE_SIZE,單位是block。所以依據系統的情況可以固定。
解決方案:調優SQL、調大SGA、調大_small_table_threshold