一:版本信息
操作系統版本:AIX 61009
數據庫版本:11.2.0.3.11(RAC)
二:錯誤描述
檢查發現一套使用ASM的rac兩個實例基本上每個小時都會報一次ORA-32701錯誤,截取alert日志中錯誤信息如下:
Sat Dec 06 09:44:00 2014
Errors in file /oracle/app/oracle/diag/rdbms/egmmdb/egmmdb2/trace/egmmdb2_dia0_13500888.trc  (incident=1041128):
ORA-32701: Possible hangs up to hang ID=0 detected
Incident details in: /oracle/app/oracle/diag/rdbms/egmmdb/egmmdb2/incident/incdir_1041128/egmmdb2_dia0_13500888_i1041128.trc
DIA0 terminating blocker (ospid: 15335610 sid: 1299 ser#: 5849) of hang with ID = 3
    requested by master DIA0 process on instance 1
    Hang Resolution Reason: Although the number of affected sessions did not
    justify automatic hang resolution initially, this previously ignored
    hang was automatically resolved.
    by terminating session sid: 1299 ospid: 15335610
Sat Dec 06 09:44:01 2014
Sweep [inc][1041128]: completed
Sweep [inc2][1041128]: completed
DIA0 successfully terminated session sid:1299 ospid:15335610 with status 31.
Sat Dec 06 09:45:35 2014
Errors in file /oracle/app/oracle/diag/rdbms/egmmdb/egmmdb2/trace/egmmdb2_dia0_13500888.trc  (incident=1041129):
ORA-32701: Possible hangs up to hang ID=0 detected
Incident details in: /oracle/app/oracle/diag/rdbms/egmmdb/egmmdb2/incident/incdir_1041129/egmmdb2_dia0_13500888_i1041129.trc
DIA0 terminating blocker (ospid: 15335610 sid: 1299 ser#: 5849) of hang with ID = 3
    requested by master DIA0 process on instance 1
    Hang Resolution Reason: Although the number of affected sessions did not
    justify automatic hang resolution initially, this previously ignored
    hang was automatically resolved.
   by terminating the process
DIA0 successfully terminated process ospid:15335610.
Sat Dec 06 09:45:37 2014
Sweep [inc][1041129]: completed
Sweep [inc2][1041129]: completed
Sat Dec 06 10:45:12 2014
Errors in file /oracle/app/oracle/diag/rdbms/egmmdb/egmmdb2/trace/egmmdb2_dia0_13500888.trc  (incident=1041130):
ORA-32701: Possible hangs up to hang ID=0 detected
Incident details in: /oracle/app/oracle/diag/rdbms/egmmdb/egmmdb2/incident/incdir_1041130/egmmdb2_dia0_13500888_i1041130.trc
Sat Dec 06 10:45:13 2014
Sweep [inc][1041130]: completed
Sweep [inc2][1041130]: completed
egmmdb2_dia0_13500888_i1041129.trc中截取如下信息:
<span style="color:#333333;">*** 2014-12-06 09:45:35.770
Resolvable Hangs in the System
                      Root       Chain Total               Hang
   Hang Hang          Inst Root  #hung #hung  Hang   Hang  Resolution
     ID Type Status   Num  Sess   Sess  Sess  Conf   Span  Action
  ----- ---- -------- ---- ----- ----- ----- ------ ------ -------------------
      3 HANG RSLNPEND    2  1299     2     2   HIGH GLOBAL Terminate Process
  Hang Resolution Reason: Although the number of affected sessions did not
    justify automatic hang resolution initially, this previously ignored
    hang was automatically resolved.

      inst# SessId  Ser#     OSPID PrcNm Event
      ----- ------ ----- --------- ----- -----
          1   1444  7855  10420452  M000 enq: FU - contention
          2   1299  5849  15335610  M000 not in wait     <span style="color:#ff0000;"><<<<====從這裡我們可以看出一個M00*進程阻塞了另一個M00*進程(從上面的alert日志中我們可以看到,Hang Manager通過殺掉造成阻塞的1299會話解決Hang問題)</span>


Dumping process info of pid[155.15335610] (sid:1299, ser#:5849)
    requested by master DIA0 process on instance 1.


*** 2014-12-06 09:45:35.770
Process diagnostic dump for oracle@egmmdb2 (M000), OS id=15335610,
pid: 155, proc_ser: 153, sid: 1299, sess_ser: 5849
-------------------------------------------------------------------------------
os thread scheduling delay history: (sampling every 1.000000 secs)
  0.000000 secs at [ 09:45:35 ]
    NOTE: scheduling delay has not been sampled for 0.376554 secs  0.000000 secs from [ 09:45:31 - 09:45:36 ], 5 sec avg
  0.000000 secs from [ 09:44:36 - 09:45:36 ], 1 min avg
  0.000000 secs from [ 09:40:36 - 09:45:36 ], 5 min avg
loadavg : 2.68 2.42 2.41
swap info: free_mem = 19881.13M rsv = 256.00M
           alloc = 138.07M avail = 65536.00M swap_free = 65397.93M
       F S      UID      PID     PPID   C PRI NI ADDR    SZ    WCHAN    STIME    TTY  TIME CMD
  240001 A   oracle 15335610        1   0  60 20 948d16590 209136 f1000a01500d48b0 08:37:22      -  0:01 ora_m000_egmmdb2
Short stack dump:
ksedsts()+360<-ksdxfstk()+44<-ksdxcb()+3384<-sspuser()+116<-49f0<-sntpread()+40<-ntpfprd()+116<-nsbasic_brc()+1116<-nsbrecv()+128<-nioqrc()+17480<-ttcdrv()+988<-nioqwa()+76<-upirtrc()+2428<-kpurcsc()+108<-kpuexec()+3088<-OCIStmtExecute()+32<-kfgGrpTableCbInternal()+2756<-kfgGrpTableCb()+48<-qerfxFetch()+3728<-qergsFetch()+6856<-opifch2()+6228<-opiefn0()+552<-opipls()+3492<-opiodr()+720<-rpidrus()+216<-skgmstack()+120<-rpidru()+132<-rpiswu2()+480<-rpidrv()+1060<-psddr0()+260<-psdnal()+472<-pevm_EXECC()+532<-pfrinstr_EXECC()+72<-pfrrun_no_tool()+96<-pfrrun()+1032<-plsql_run()+616<-peicnt()+320<-kkxexe()+508<-opiexe()+17224<-opiall0()+1296<-opikpr()+488<-opiodr()+720<-rpidrus()+216<-skgmstack()+120<-rpidru()+132<-rpiswu2()+480<-kprball()+1036<-kkxsexr()+380<-kkxsexe()+604<-pevm_icd_call_common()+896<-pfrinstr_ICAL()+156<-pfrrun_no_tool()+96<-pfrrun()+1032<-plsql_run()+616<-peicnt()+320<-kkxexe()+508<-opiexe()+17224<-kpoal8()+4616<-opiodr()+720<-kpoodrc()+36<-rpiswu2()+480<-kpoodr()+512<-upirtrc()+1328<-kpurcsc()+108<-kpuexec()+10448<-OCIStmtExecute()+32<-kewuxs_execute_statement()+676<-kewfeus_execute_usage_sampling()+268<-kewfads_auto_dbfus_slave()+1296<-kebm_slave_main()+492<-ksvrdp()+1708<-opirip()+724<-opidrv()+608<-sou2o()+136<-opimai_real()+188<-ssthrdmain()+268<-main()+204<-__start()+112

-------------------------------------------------------------------------------
Process diagnostic dump actual duration=0.084000 sec
  (max dump time=15.000000 sec)


*** 2014-12-06 09:45:35.854
current sql: SELECT MAX(TOTAL_MB), MIN(TOTAL_MB), SUM(TOTAL_MB), COUNT(*) FROM V$ASM_DISKGROUP <<span style="color:#ff0000;"><<<====M000的進程在進行磁盤組空間的統計。(相同的情況在節點2上也在發生,也同時在ON CPU上執行current sql: SELECT MAX(TOTAL_MB), MIN(TOTAL_MB), SUM(TOTAL_MB), COUNT(*) FROM V$ASM_DISKGROUP ,產生節點1和節點2之間M000進程的交叉等待,之後Hang manager介入殺掉進程,同時提示ORA-32701 ),關於這種相互等待我們可以參考enq: FU - contention' and ORA-32701 Warning Seen in Alert Log (Doc ID 1464844.1)                                                                     </span>
***********中間部分內容省略 ***********************
下面我們來看一下trace文件中Current Wait Stack部分類容
Current Wait Stack:
                        Not in wait; last wait ended 58 min 27 sec ago  <span style="color:#ff0000;"><<<<====一個新的會話需要獨占FU enqueue,獲取失敗,發現FU enqueue已經被另一個會話持有(在not in wait狀態下持有超過58分鐘),並且另一個會話整出not in wait狀態,所以最後持有FU enqueue的會話被Hang Manager殺掉。</span>
                      There are 1 sessions blocked by this session.
                      Dumping one waiter:
                        inst: 1, sid: 1444, ser: 7855
                        wait event: 'enq: FU - contention'
                          p1: 'name|mode'=0x46550006
                          p2: '0'=0x0
                          p3: '0'=0x0
                        row_wait_obj#: 4294967295, block#: 0, row#: 0, file# 0
                        min_blocked_time: 534 secs, waiter_cache_ver: 31914
                      Wait State:
                        fixed_waits=0 flags=0x20 boundary=0x0/-1
                      Session Wait History:
                          elapsed time of 58 min 27 sec since last wait
                       0: waited for 'latch free'
                          address=0x7000000000356a0, number=0x13c, tries=0x0
                          wait_id=12785 seq_num=20683 snap_id=1
                          wait times: snap=0.001418 sec, exc=0.001418 sec, total=0.001418 sec
                          wait times: max=infinite
                          wait counts: calls=0 os=0
                          occurred after 0.001614 sec of elapsed time
                       1: waited for 'control file sequential read'
                          file#=0x0, block#=0x1a, blocks=0x1
                          wait_id=12784 seq_num=20682 snap_id=1
                          wait times: snap=0.000258 sec, exc=0.000258 sec, total=0.000258 sec
                          wait times: max=infinite
                          wait counts: calls=0 os=0
                          occurred after 0.000016 sec of elapsed time</span></span>
要處理這個問題我們需要先了解一下 oracle 11g 新特性—hang 管理器(Hang Manager),關於Hang Manager詳細內容可以參考我的另一篇博客
http://blog.csdn.net/shaochenshuo/article/details/41845079(取自MOS)。
看完Hang Manager,結合上面alert日志及trace的分析我們知道報錯的原因是FU enqueue的爭用。但是為什麼會產生FU enqueue的爭用呢,為什麼導致阻塞的會話會保持FU enqueue 58分鐘這麼久的時間?
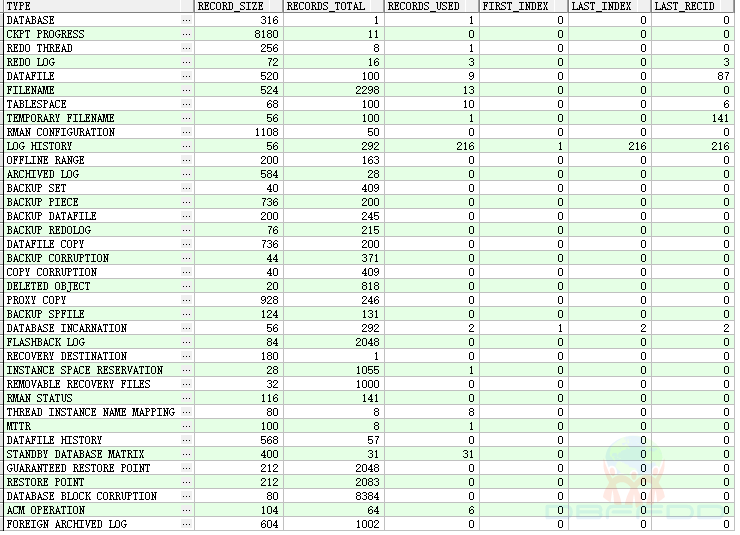
我試著在執行手動執行SELECT MAX(TOTAL_MB), MIN(TOTAL_MB), SUM(TOTAL_MB), COUNT(*) FROM V$ASM_DISKGROUP;語句,發現語句一直處於Hang著不動,等了幾十分鐘都沒有結果。接著有試著查看了asm_disk,也是被HANG住。這就難怪數據庫會報ORA-32701錯誤了,數據庫MMON的子進程在搜集磁盤組的使用信息時,被HANG住(推測這個信息可能是每隔一個小時會收集一次,因為這個報錯大概一個小時會發生一次。當下次收集任務開始時,發現FU enqueue還在被上一個任務持有,然後通過Hang Manager殺掉了上一個會話,如此往復)。
那麼問題又來了,為什麼訪問與磁盤信息有關的視圖會Hang住呢?
MOS上找到一遍NOTE貌似跟我們報錯一樣,'enq: FU - contention' and ORA-32701 Warning Seen in Alert Log (Doc ID 1464844.1)。這個上面說可能是因為統計信息有問題,導致查詢Hang,但是數據庫fixed objects統計信息是沒有問題的。
沒有辦法提了SR,但是一個多月過去了,oracle也沒查出問題原因。看來還是只能靠自己啊,根據經驗asm_diskstring異常經常會導致查詢磁盤相關視圖慢,我們的數據庫該參數是空的(正常情況下是沒有問題的,該參數不設置,ASM也會根據操作系統不同到相關目錄下去掃描磁盤)。所以我猜測這個問題有可能是該參數引起的。根據猜測准備重置該參數alter system set asm_diskstring='' scope=both;發現該語句也被hang住。最後重啟實例,實例重啟後數據庫不再報ORA-32701,disk相關視圖也能正常查詢。
報錯解決了,但是觸發該報錯的具體原因還不清楚,後續如果結果會及時更新。
##下面是mos上相關note
'enq: FU - contention' and ORA-32701 Warning Seen in Alert Log (Doc ID 1464844.1)
Queries On V$Asm_diskgroup Are Taking Long Time (Doc ID 1552549.1)
Bug 8786114 - V$asm_disk query takes way too long, kfod commands hang (Doc ID 8786114.8)
Many
sessions hang resolved by Hang Manager with ORA-32701 in alert log while the blocker is in 'Not in wait' status (Doc ID 1926781.1)