第一種。使用函數導入到某個庫中
A. 使用 fn_trace_gettable 從跟蹤文件導入行
以下示例在 SELECT...INTO 語句的 FROM 子句內部調用 fn_trace_gettable。
USE AdventureWorks;
GO
SELECT * INTO temp_trc
FROM fn_trace_gettable('c:\temp\my_trace.trc', default);
GO
B. 使用 fn_trace_gettable 返回一個表,其中具有可以加載到 SQL Server 表中的 IDENTITY 列
以下示例在 SELECT...INTO 語句中調用該函數,並返回一個表,其中具有可加載到表 temp_trc 中的 IDENTITY 列。
USE AdventureWorks;
GO
SELECT IDENTITY(int, 1, 1) AS RowNumber, * INTO temp_trc
FROM fn_trace_gettable('c:\temp\my_trace.trc', default);
GO
第二種,使用Read80Trace工具完成(下載地址:http://www.microsoft.com/downloads/details.ASPx?FamilyId=5691AB53-893A-4AAF-B4A6-9A8BB9669A8B&displaylang=en)
這種方法我在sql2005上沒成功過,會報is not a valid 8.0 trace file format,錯誤,我想是因為2005是9.0版本引起的。
sql2000的話,成功了,使用下面的命令
Read80Trace -f -Slocalhost -Usa -PpassWord -Dtracedb -IE:\profiler\mytrace.trc
其中-f是關掉Read80Trace生成的rml文件,這個文件也很大,可以不用生成,我運行時就關掉了
-I是指定trc文件所在的位置,如果目錄下面有mytrace_1.trc...mytrace_n.trc,Read80Trace會自動讀取它們.
-Dtracedb是將把trace日志的數據載入的數據庫名稱,所以在-U時需要此用戶具有創建數據的權限
-U -P就不用說了吧,注意命令的格式,-S和localhost中間沒有空格
如果成功會在安裝目錄的的output目錄下面生成以下文件
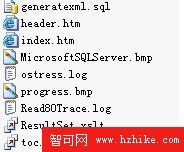
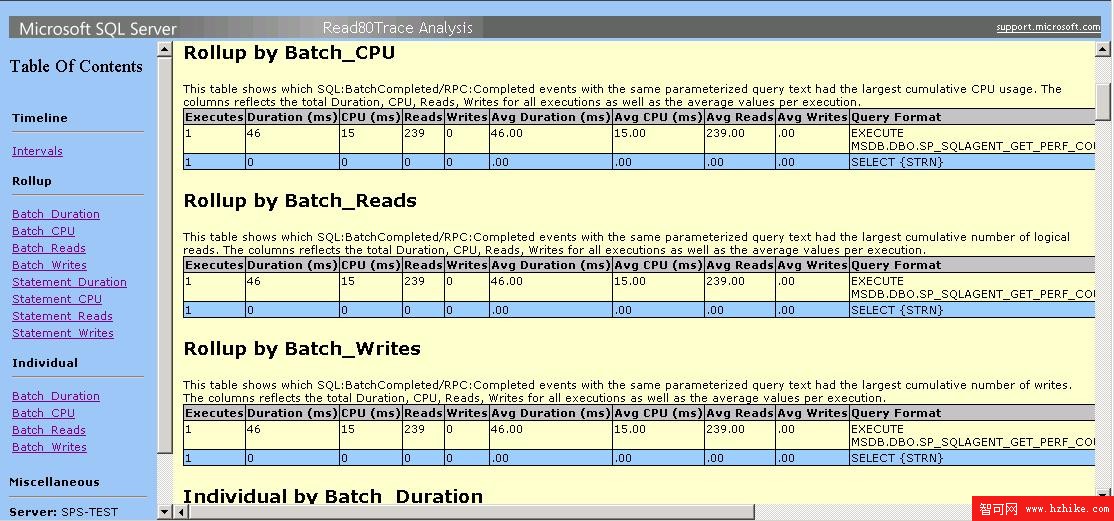
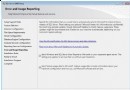
安裝msXML4.0才能正常顯示(我安裝了6.0打不開),這個報表是這個存儲過程執行結果
set ANSI_NULLS ON
set QUOTED_IDENTIFIER ON
go
ALTER proc [dbo].[usp_GetAccessPattern]
@duration_filter int=-1 --傳入的參數,可以按照語句執行的時間過濾統計
as begin
/*首先得到全部語句的性能數據的總和*/
declare @sum_total float,@sum_cpu float,@sum_reads float,@sum_duration float,@sum_writes float
select @sum_total=count(*)*0.01,--這是所有語句的總數。
@sum_cpu=sum(cpu)*0.01, --這是所有語句耗費的CPU時間
@sum_reads=sum(reads)*0.01, --這是所有語句耗費的Reads數目,8K為單位。
@sum_writes=sum(writes)*0.01,--這是所有語句耗費的Writes數目,8K為單位。
@sum_duration=sum(duration)*0.01--這是所有語句的執行時間總和。
from tblBatches --這是Read80Trace產生的表,包括了Trace文件中所有的語句。
where duration>=@duration_filter --是否按照執行時間過濾
/*然後進行Group by,得到某類語句占用的比例*/
Select ltrim(str(count(*))) exec_stats,''+ str(count(*)/@sum_total,4,1)+'%' ExecRatio,
ltrim(str(sum(cpu)))+' : '++ltrim(str(avg(cpu))) cpu_stats,''+str(sum(cpu)/@sum_cpu,4,1)+'%' CpuRatio,
ltrim(str(sum(reads) ))+' : '+ltrim(str(avg(reads) )) reads_stats,''+str(sum(reads)/@sum_reads,4,1) +'%' ReadsRatio ,
--ltrim(str(sum(writes) ))+' : '+ltrim(str(avg(writes) )) --writes_stats,''+str(sum(writes)/@sum_writes,4,1) +'%)',
ltrim(str(sum(duration) ))+' : '+ltrim(str(avg(duration))) duration_stats,''+str(sum(duration)/@sum_duration,4,1)+'%' DurRatio ,
textdata,count(*)/@sum_total tp,sum(cpu)/@sum_cpu cp,sum(reads)/@sum_reads rp,sum(duration)/@sum_duration dp
into #querIEs_staticstics from
/* tblUniqueBatches表中存放了所有標准化的語句。*/
(select reads,cpu,duration,writes,convert(varchar(2000),NormText)textdata from tblBatches
inner join tblUniqueBatches on tblBatches.HashId=tblUniqueBatches.hashid where duration>@duration_filter
) B group by textdata --這個group by很重要,它對語句進行歸類統計。
print 'Top 10 order by cpu+reads+duration'
select top 10 * from #querIEs_staticstics order by cp+rp+dp desc
print 'Top 10 order by cpu'
select top 10 * from #querIEs_staticstics order by cp desc
print 'Top 10 order by reads'
select top 10 * from #querIEs_staticstics order by rp desc
print 'Top 10 order by duration'
select top 10 * from #querIEs_staticstics order by dp desc
print 'Top 10 order by batches'
select top 10 * from #querIEs_staticstics order by tp desc
End
/*************************************************************/
如果沒有導入成功報錯,大部分情況是因為列不夠引起的,錯誤代碼一般是這樣
WARNING: The following trace events were not captured: SQL:BatchStarting, RPC:Starting, SP:StmtStarting, SP:StmtCompleted, Showplan Statistics. RevIEw the help file to ensure that you have collected the appropriate set of events and columns for your intended analysis.
ERROR: Event 10 does not contain the following required column(s): 15
WARNING: Event 10 does not contain the following recommended column(s): 13, 16, 17, 18
ERROR: Event 12 does not contain the following required column(s): 15
WARNING: Event 12 does not contain the following recommended column(s): 13, 16, 17, 18
ERROR: Event 14 does not contain the following required column(s): 15
ERROR: Event 15 does not contain the following required column(s): 15
WARNING: Event 15 does not contain the following recommended column(s): 1, 13, 16, 17, 18
ERROR: Performance analysis has been disabled because one or more events is missing required columns. Consult the help file for the recommended set of trace events and necessary columns.
Reads completed - Global Error Status 120
READER: Total Read Count: 3 Read Stall Count: 0 accounting for 0 ms in reader thread
Signaling all workers to complete
Handling final iOS and closing open files
Flushing and Compressing SPID Files
Total Events Processed: 1
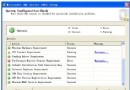
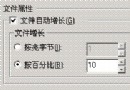
這時候就要在應用事件查探器裡增加選取以下"數據列"監視
TSQL:
exec Propared SQL
SQL:BatchCompleted
SQL:BatchStarting
安全審核:
Audit login
Audit Logout
存儲過程:
RPC:Completed
RPC:Starting
SP:Completed
SP:StmtCompleted
SP:StmtStarting
會話:
ExistingConnection
性能:
Show Plan statistics
數據列
DatabaseID
EndTime
ObjectID
NestLevel
IntegerData
EventClass
TextData
ApplicationName
NTUserName
Loginname
CPU
Reads
Writes
Duration
ClIEntProcessID
SPID
StartTime
附上一張完成後的截圖