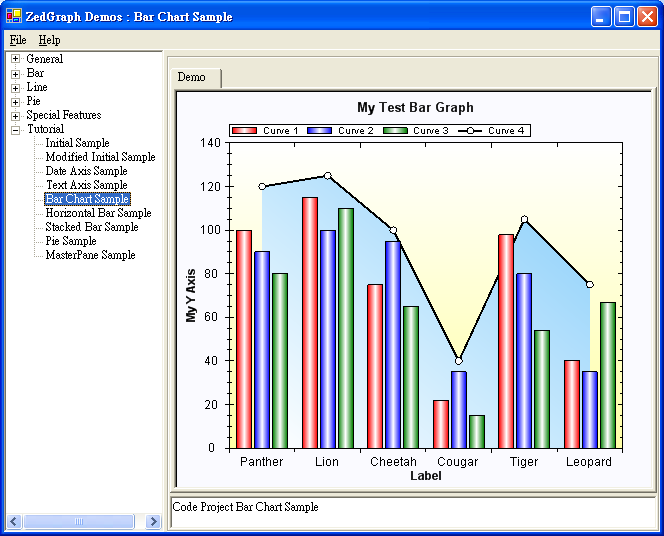
從這節開始,我們將進入柱形圖的研究(如下圖),首先從最簡單的BarChartSampleDemo開始,我們一 步一步進入ZedGraph的柱形世界。
代碼如下:
using System;


using System.Drawing;


using System.Collections;


using ZedGraph;


namespace ZedGraph.Demo


{


     ///<summary>


     /// Summary description for SimpleDemo.


     ///</summary>


     public class BarChartSampleDemo : DemoBase


     {


           public BarChartSampleDemo() : base( "Code Project Bar Chart Sample",


                "Bar Chart Sample", DemoType.Tutorial )


           {


                GraphPane myPane = base.GraphPane;


                // Set the titles and axis labels


                myPane.Title = "My Test Bar Graph";


                myPane.XAxis.Title = "Label";


                myPane.YAxis.Title = "My Y Axis";


                // Make up some random data points


                string[] labels = { "Panther", "Lion", "Cheetah", "Cougar", "Tiger", "Leopard" };


                double[] y = { 100, 115, 75, 22, 98, 40 };


                double[] y2 = { 90, 100, 95, 35, 80, 35 };


                double[] y3 = { 80, 110, 65, 15, 54, 67 };


                double[] y4 = { 120, 125, 100, 40, 105, 75 };


                // Generate a red bar with "Curve 1" in the legend


                BarItem myBar = myPane.AddBar( "Curve 1", null, y, Color.Red );


                myBar.Bar.Fill = new Fill( Color.Red, Color.White, Color.Red );


                // Generate a blue bar with "Curve 2" in the legend


                myBar = myPane.AddBar( "Curve 2", null, y2, Color.Blue );


                myBar.Bar.Fill = new Fill( Color.Blue, Color.White, Color.Blue );


                // Generate a green bar with "Curve 3" in the legend


                myBar = myPane.AddBar( "Curve 3", null, y3, Color.Green );


                myBar.Bar.Fill = new Fill( Color.Green, Color.White, Color.Green );


                // Generate a black line with "Curve 4" in the legend


                LineItem myCurve = myPane.AddCurve( "Curve 4",


                     null, y4, Color.Black, SymbolType.Circle );


                myCurve.Line.Fill = new Fill( Color.White, Color.LightSkyBlue, -45F );


                // Fix up the curve attributes a little


                myCurve.Symbol.Size = 8.0F;


                myCurve.Symbol.Fill = new Fill( Color.White );


                myCurve.Line.Width = 2.0F;


                // Draw the X tics between the labels instead of at the labels


                myPane.XAxis.IsTicsBetweenLabels = true;


                // Set the XAxis labels


                myPane.XAxis.TextLabels = labels;


                // Set the XAxis to Text type


                myPane.XAxis.Type = AxisType.Text;


                // Fill the axis area with a gradient


                myPane.AxisFill = new Fill( Color.White,


                     Color.FromArgb( 255, 255, 166), 90F );


                // Fill the pane area with a solid color


                myPane.PaneFill = new Fill( Color.FromArgb( 250, 250, 255) );


                base.ZedGraphControl.AxisChange();


           }


     }


}
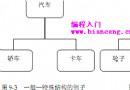
這一節,我們主要介紹BarItem這個類,這個類就是ZedGraph中關於柱形的類。它的繼承關系如下:
System.Object

   ZedGraph.CurveItem      ZedGraph.BarItem
它的基類ZedGraph.CurveItem裡包含了Pane上單個曲線圖表的數據和方法。它實現了圖表的屬性設置 ,例如關鍵詞(Key),成員的名字、顏色、符號、尺寸和線條的風格等等。
BarItem中有五個構造函數,其中有兩個是大家常用的,如下:
//Create a new BarItem, specifying only the legend label for the bar.


public BarItem(string);


//Create a new BarItem using the specified properties.


public BarItem(string,double[],double[],Color);


BarItem myBar = myPane.AddBar( "Curve 1", null, y, Color.Red );


myBar.Bar.Fill = new Fill( Color.Red, Color.White, Color.Red );
這裡用的是直接用Pane裡的AddBar來設定柱形,並且返回一個BarItem的引用,讓用戶來對這個Bar進 行進一步的描述。我們可以看到構造函數中的 ”Curve1”就是在Legend中要顯示的文字(關於Legend請看 第一節)。X軸上的軸標先不設定,後面跟著Y軸和這個Bar的顏色。
第二行代碼就使用myBar這個引用來對這個Bar進行紅—白—紅的顏色填充。
// Draw the X tics between the labels instead of at the labels


myPane.XAxis.IsTicsBetweenLabels = true;


// Set the XAxis labels


myPane.XAxis.TextLabels = labels;


// Set the XAxis to Text type


myPane.XAxis.Type = AxisType.Text;
第一行代碼主要是對X軸上柱形的位置做一個設定,默認是居中對齊,如果不設定這一項目,或者設定 這一項為false,則柱形在界面上的顯示是居中的,如下圖:(myPane.XAxis.IsTicsBetweenLabels = false;)
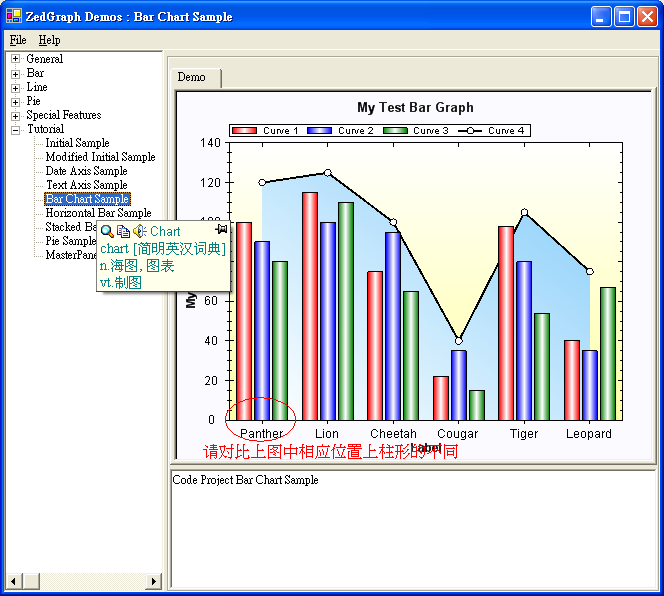
第二、三行代碼的意思是設定X軸的坐標以文本方式顯示,文本內容來自
string[] labels。
// Fill the axis area with a gradient


myPane.AxisFill = new Fill( Color.White,Color.FromArgb( 255, 255, 166), 90F );


// Fill the pane area with a solid color


myPane.PaneFill = new Fill( Color.FromArgb( 250, 250, 255) );
最後兩句一個是設定Pane中軸的背景顏色,以90度的角度從白到淡黃的漸變效果;另一個是設定Pane 的背景色,是淡灰白色,在圖中體現的不明顯,請大家自己改成Color.FromArgb( 250 , 250 , 0 )試試 效果吧。
最後那個全填充的曲線圖在第1,2,3,4節中已經都介紹過了,這裡不再重復,請自己參看以前的章 節。