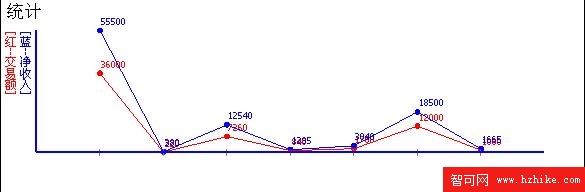
2.線狀圖,效果如下:
代碼 如下:
注意:請注意參數 chartTable 圖形裡的一些元素需要從chartTable裡面取。具體請查看代碼。
//Render是圖形大標題,圖開小標題,圖形寬度,圖形長度,餅圖的數據集和餅圖的數據集

        public Image Render(string title, int width, int height, DataTable chartTable)

        {

            Bitmap bm = new Bitmap(width, height);

            Graphics g = Graphics.FromImage(bm);

            g.Clear(Color.White);

            const int top = 30;

            const int left = 35;

            if (width < left * 2 || height < top * 2)

            {

                g.DrawString("繪圖區域太小" ,new Font("Tahoma", 8),

                    Brushes.Blue, new PointF(0, 0));

                return bm;

            }

            if (chartTable == null)

            {

                g.DrawString("沒有數據", new Font("Tahoma", 7),

                    Brushes.Blue, new PointF(0, 0));

                return bm;

            }

            DataTable dt = chartTable;

            //計算最高的點

            float highPoint = 1;

            foreach (DataRow dr in dt.Rows)

            {

                if (highPoint < Convert.ToSingle(dr[0]))

                {

                    highPoint = Convert.ToSingle(dr[0]);

                }

                if (highPoint < Convert.ToSingle(dr[1]))

                {

                    highPoint = Convert.ToSingle(dr[1]);

                }

            }

            //建立一個Graphics對象實例

            try

            {

                //畫大標題

                g.DrawString(title, new Font("Tahoma", 12), Brushes.Black, new PointF(2, 2));

                StringFormat drawFormat = new StringFormat();

                drawFormat.FormatFlags = StringFormatFlags.DirectionVertical;

                g.DrawString("[紅--" + dt.Columns[0].ToString() + "]", new Font("Tahoma", 8),

                    Brushes.Red, new PointF(2, top), drawFormat);

                g.DrawString("[藍--" + dt.Columns[1].ToString() + "]", new Font("Tahoma", 8),

                    Brushes.Blue, new PointF(17, top), drawFormat);

                //畫條形圖

                float barWidth = (Convert.ToSingle(width) - left) / (dt.Rows.Count + 1);

                PointF barOrigin = new PointF(left + barWidth , 0);

                float barHeight = dt.Rows.Count;

                float topFontSize = 7;

                float bottomFontSize = 7;

                PointF[] pt1 = new PointF[dt.Rows.Count];

                PointF[] pt2 = new PointF[dt.Rows.Count];

                for (int i = 0; i < dt.Rows.Count; i++)

                {

                    //底部字體的大小

                    barHeight = Convert.ToSingle(dt.Rows[i][0]) * (height - 2 * top) / highPoint * 1;

                    barOrigin.Y = height - barHeight - top;

                    g.FillEllipse(new SolidBrush(Color.Red), barOrigin.X - 3, barOrigin.Y - 3, 6, 6);

                    pt1[i] = new PointF(barOrigin.X, barOrigin.Y);

                    //頂部

                    g.DrawString(dt.Rows[i][0].ToString(), new Font("Tahoma", topFontSize), Brushes.Red,

                        new PointF(barOrigin.X, barOrigin.Y - 4 * topFontSize / 2));

                    barHeight = Convert.ToSingle(dt.Rows[i][1]) * (height - 2 * top) / highPoint * 1;

                    barOrigin.Y = height - barHeight - top;

                    g.FillEllipse(new SolidBrush(Color.Blue), barOrigin.X - 3, barOrigin.Y - 3, 6, 6);

                    pt2[i] = new PointF(barOrigin.X, barOrigin.Y);

                    //頂部

                    g.DrawString(dt.Rows[i][1].ToString(), new Font("Tahoma", topFontSize), Brushes.Blue,

                        new PointF(barOrigin.X, barOrigin.Y - 4 * topFontSize / 2));

                    barOrigin.X = barOrigin.X + barWidth;

                }

                if (dt.Rows.Count > 10)

                {

                    int dis = dt.Rows.Count / 10;

                    for (int i = 0; i < dt.Rows.Count; i++)

                    {

                        if (i % dis == 0)

                        {

                            g.DrawLine(new Pen(Color.Blue, 2), new PointF(left + (i + 1) * barWidth, height -

top + 5),

                                new PointF(left + (i + 1) * barWidth, height - top - 3));

                            //底部

                            g.DrawString(dt.Rows[i][2].ToString(), new Font("Tahoma", bottomFontSize),

Brushes.Black,

                                new PointF(left + (i + 1) * barWidth, height - top));

                        }

                        else

                        {

                            g.DrawLine(new Pen(Color.Gray, 1), new PointF(left + (i+1) * barWidth, height -

top + 3),

                                new PointF(left + (i+1) * barWidth, height - top - 3));

                        }

                    }

                }

                else

                {

                    for (int i = 0; i < dt.Rows.Count; i++)

                    {

                        g.DrawLine(new Pen(Color.Gray, 1), new PointF(left + (i + 1) * barWidth, height - top

+ 3),

                            new PointF(left + (i + 1) * barWidth, height - top - 3));

                    }

                }

                //繪制曲線

                g.DrawLines(new Pen(new SolidBrush(Color.Red), 1), pt1);

                g.DrawLines(new Pen(new SolidBrush(Color.Blue),1), pt2);

                //設置邊

                g.DrawLine(new Pen(Color.Blue, 2), new Point(left, top),

                    new Point(left, height - top));

                g.DrawLine(new Pen(Color.Blue, 2), new Point(left, height - top),

                    new Point(left + width, height - top));

                g.Dispose();

                return bm;

            }

            catch

            {

                return bm;

            }

        }
補充一句:轉載的朋友請一定注明出處謝謝!半支煙阿傑