在我們程序開發的過程中經常會需要繪制曲線圖和柱狀圖等,尤其是在做統計功能時。但是有時候我們有覺得沒有必要使用第三方控件(例 如:ZedGraph等),這是我們可以自己編寫代碼來實現這些圖形繪制的功能。以下是我在開發過程中所使用過的兩段代碼,現共享大家,希望 能給大家帶來一定的幫助,如有不妥敬請斧正!
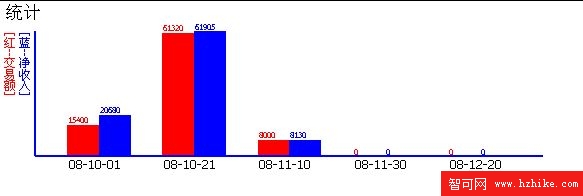
1.柱狀圖,效果圖如下
代碼如下:
注意:請注意參數 chartTable 圖形裡的一 些元素需要從chartTable裡面取。具體請查看代碼。
//Render是圖形大標題,圖開小標題,圖形寬度,圖形長度,餅圖的數據集和餅圖的數據集

public Image Render(string title, int width, int height, DataTable chartTable)

        {

            Bitmap bm = new Bitmap(width, height);

            Graphics g = Graphics.FromImage(bm);

            g.Clear(Color.White);

            DataTable dt = chartTable;

            const int top = 30;

            const int left = 35;

            if (width < left * 2 || height < top * 2)

            {

                g.DrawString("繪圖區域太小", new Font("Tahoma", 8),

                    Brushes.Blue, new PointF(0, 0));

                return bm;

            }


            //計算最高的點

            float highPoint = 1;

            foreach (DataRow dr in dt.Rows)

            {

               if (highPoint < Convert.ToSingle(dr[0]))

                {

                    highPoint = Convert.ToSingle(dr[0]);

                }

                if (highPoint < Convert.ToSingle(dr[1]))

                {

                    highPoint = Convert.ToSingle(dr[1]);

                }

            }

            try

            {

                //畫大標題

                g.DrawString(title, new Font("Tahoma", 12), Brushes.Black, new PointF(2, 2));

                StringFormat drawFormat = new StringFormat();

                drawFormat.FormatFlags = StringFormatFlags.DirectionVertical;

                g.DrawString("[紅--" + dt.Columns[0].ToString() + "]", new Font("Tahoma", 8),

                    Brushes.Red, new PointF(2, top), drawFormat);

                g.DrawString("[藍--" + dt.Columns[1].ToString() + "]", new Font("Tahoma", 8),

                    Brushes.Blue, new PointF(17, top), drawFormat);


                //畫條形圖

                float barWidth = (Convert.ToSingle(width) - left) / (dt.Rows.Count * 3 + 1);

                PointF barOrigin = new PointF(left + barWidth, 0);

                float barHeight = dt.Rows.Count;

                float topFontSize = (barWidth / highPoint.ToString().Length);


                if (topFontSize > 2*top/3)

                {

                    topFontSize = 2*top/3;

                }

                if (topFontSize < 5)

                {

                    topFontSize = 5;

                }

                for (int i = 0; i < dt.Rows.Count; i++)

                {

                    //底部字體的大小

                    float bottomFontSize = (2 * barWidth / dt.Rows[i][2].ToString().Length) + 2;

                    if (bottomFontSize > 2 * top / 3)

                    {

                        bottomFontSize = 2 * top / 3;

                    }

                    barHeight = Convert.ToSingle(dt.Rows[i][0]) * (height - 2 * top) / highPoint * 1;

                    barOrigin.Y = height - barHeight - top;

                    g.FillRectangle(new SolidBrush(Color.Red), barOrigin.X, barOrigin.Y, barWidth, barHeight);

                    //柱狀圖底部

                    g.DrawString(dt.Rows[i][2].ToString(), new Font("Tahoma", bottomFontSize), Brushes.Black,

                        new PointF(barOrigin.X, height - top));

                    //柱狀圖頂部

                    g.DrawString(dt.Rows[i][0].ToString(), new Font("Tahoma", topFontSize), Brushes.Red,

                        new PointF(barOrigin.X, barOrigin.Y - 3*topFontSize/2));

                    barOrigin.X = barOrigin.X + barWidth;


                    barHeight = Convert.ToSingle(dt.Rows[i][1]) * (height - 2 * top) / highPoint * 1;

                    barOrigin.Y = height - barHeight - top;

                    g.FillRectangle(new SolidBrush(Color.Blue), barOrigin.X, barOrigin.Y, barWidth,


barHeight);

                    //柱狀圖頂部

                    g.DrawString(dt.Rows[i][1].ToString(), new Font("Tahoma", topFontSize), Brushes.Blue,

                        new PointF(barOrigin.X, barOrigin.Y - 3 * topFontSize/2));

                    barOrigin.X = barOrigin.X + (barWidth * 2);

                }

                //設置邊

                g.DrawLine(new Pen(Color.Blue, 2), new Point(left, top),

                    new Point(left, height - top));

                g.DrawLine(new Pen(Color.Blue, 2), new Point(left, height - top),

                    new Point(left + width, height - top));


                g.Dispose();

                return bm;

            }

            catch

            {

                return bm;

            }

        }