最近一直挺忙的,都沒時間寫博客了,好在這是基礎篇的最後一篇了,我也可以歇歇了,關於其它的 深入章節我會在以後的時間補上的。
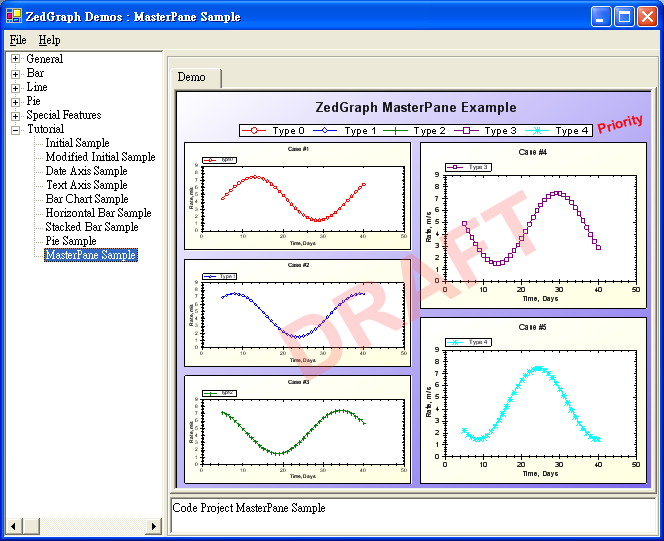
先來看看這一節的示圖和源代碼吧。
using System;

using System.Drawing;

using System.Collections;

using ZedGraph;

namespace ZedGraph.Demo

{

     ///<summary>

     /// Summary description for SimpleDemo.

     ///</summary>

     public class MasterSampleDemo : DemoBase

     {

         public MasterSampleDemo() : base( "Code Project MasterPane Sample",

                  "MasterPane Sample", DemoType.Tutorial )

         {

              MasterPane myMaster = base.MasterPane;

              // Remove the default GraPHPane that comes with ZedGraphControl

              myMaster.PaneList.Clear();

              // Set the masterpane title

              myMaster.Title = "ZedGraph MasterPane Example";

              myMaster.IsShowTitle = true;

              // Fill the masterpane background with a color gradIEnt

              myMaster.PaneFill = new Fill( Color.White, Color.MediumSlateBlue, 45.0F );

              // Set the margins to 10 points

              myMaster.MarginAll = 10;

              // Enable the masterpane legend

              myMaster.Legend.IsVisible = true;

              myMaster.Legend.Position = LegendPos.TopCenter;

              // Add a priority stamp

              TextItem text = new TextItem( "Priority", 0.88F, 0.12F );

              text.Location.CoordinateFrame = CoordType.PaneFraction;

              text.FontSpec.Angle = 15.0F;

              text.FontSpec.FontColor = Color.Red;

              text.FontSpec.IsBold = true;

              text.FontSpec.Size = 15;

              text.FontSpec.Border.IsVisible = false;

              text.FontSpec.Border.Color = Color.Red;

              text.FontSpec.Fill.IsVisible = false;

              text.Location.AlignH = AlignH.Left;

              text.Location.AlignV = AlignV.Bottom;

              myMaster.GraphItemList.Add( text );

              // Add a draf watermarkè

              text = new TextItem( "DRAFT", 0.5F, 0.5F );

              text.Location.CoordinateFrame = CoordType.PaneFraction;

              text.FontSpec.Angle = 30.0F;

              text.FontSpec.FontColor = Color.FromArgb( 70, 255, 100, 100 );

              text.FontSpec.IsBold = true;

              text.FontSpec.Size = 100;

              text.FontSpec.Border.IsVisible = false;

              text.FontSpec.Fill.IsVisible = false;

              text.Location.AlignH = AlignH.Center;

              text.Location.AlignV = AlignV.Center;

              text.ZOrder = ZOrder.A_InFront;

              myMaster.GraphItemList.Add( text );

              // Initialize a color and symbol type rotator

              ColorSymbolRotator rotator = new ColorSymbolRotator();

              // Create some new GraPHPanes

              for ( int j=0; j<5; j++ )

              {

                  // Create a new graph - rect dimensions do not matter here, since it

                  // will be resized by MasterPane.AutoPaneLayout()

                  GraphPane myPane = new GraPHPane( new Rectangle( 10, 10, 10, 10 ),

                       "Case #" + (j+1).ToString(),

                       "Time, Days",

                       "Rate, m/s" );

                  // Fill the GraPHPane background with a color gradIEnt

                  myPane.PaneFill = new Fill( Color.White, Color.LightYellow, 45.0F );

                  myPane.BaseDimension = 6.0F;

                  // Make up some data arrays based on the Sine function

                  PointPairList list = new PointPairLis_u40 ?);

                  for ( int i=0; i<36; i++ )

                  {

                       double x = (double) i + 5;

                       double y = 3.0 * ( 1.5 + Math.Sin( (double) i * 0.2 + (double) j ) );

                       list.Add( x, y );

                  }

                  // Add a curve to the Graph, use the next sequential color and symbol

                  LineItem myCurve = myPane.AddCurve( "Type " + j.ToString (),

                       list, ro_u97 ?tor.NextColor, rotator.NextSymbol );

                  // Fill the symbols with white to make them opaque

                  myCurve.Symbol.Fill = new Fill( Color.White );

                  // Add the GraPHPane to the MasterPane

                  myMaster.Add( myPane );

              }

              Graphics g = this.ZedGraphControl.CreateGraphics();

              // Tell ZedGraph to auto layout the new GraPHPanes

              myMaster.AutoPaneLayout( g, PaneLayout.ExplicitRow32 );

              myMaster.AxisChange( g );

              g.Dispose();

         }

     }

}