監測ASP.NET應用程序性能有很多種方法,你心目最簡單的方法是什麼?
我目前找到的最簡單的方法是:在Windows性能監視器(Performact Monitor)中監測ASP.NET Applications的Request Execution Time參數。

微軟網站上對Request Execution Time的解釋:
This counter shows the time, in milliseconds, that it takes to render the last requested page and then transmit it to the user. This counter will generally be greater than the time a trace shows to render the page. This counter is a more comprehensive measurement of start-to-finish request time. If this counter shows a lower average when compared to a baseline, then both the scalability and the performance of the application have been increased.
我對Request Execution Time的理解是:ASP.NET Runtime接收到IIS轉發過來的用戶請求->ASP.NET Runtime將該請求的響應內容發送給IIS所消耗的時間。
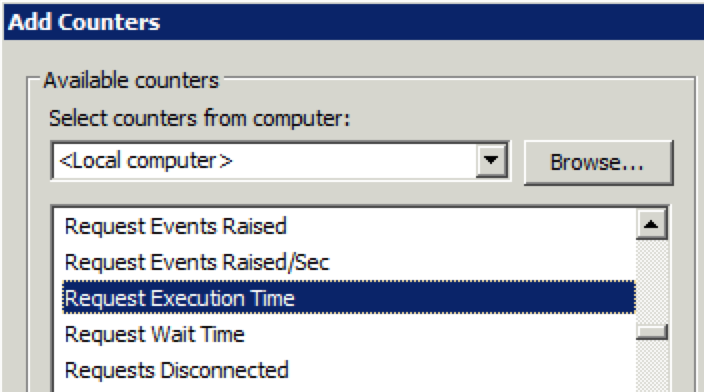
在Windows性能監視器中添加Request Execution Time計數器的操作步驟:
1. 打開Windows性能監視器,點擊加號按鈕。
2. 找到ASP.NET Applications
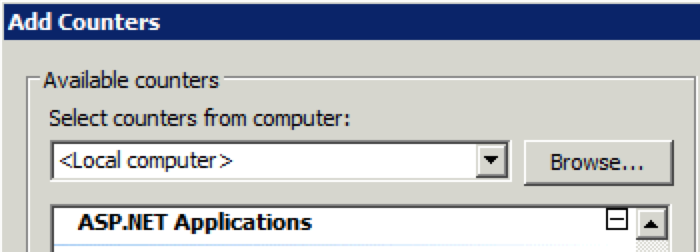
3. 找到Request Execution Time