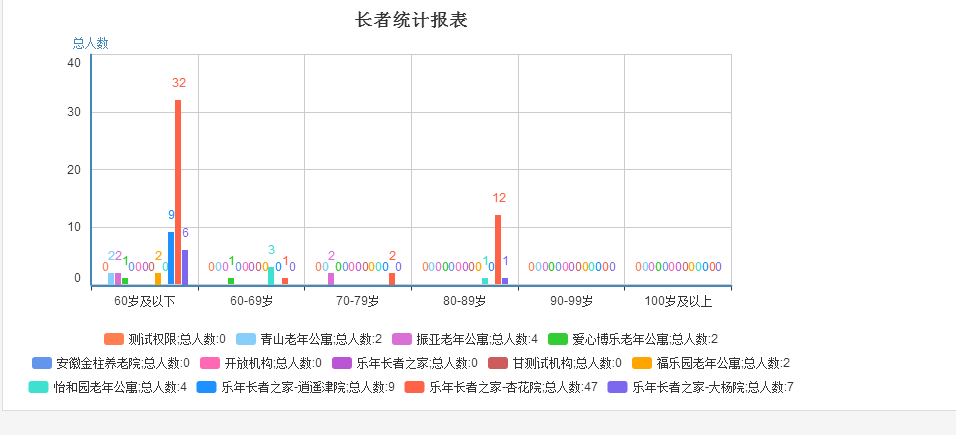
新公司,剛來幾天,閒著沒事,領導讓我做些無關痛癢的活,優化報表統計!!!之前是用flash做的,現在要改成echart實現。好吧,之前沒用過,抱著學習態度,研究了下。寫點東西打發下時間,能幫到需要幫助朋友更好。好了廢話少說,開搞!
第一步搞個頁面:
第二部:添加相關js引用,參照api,初始化js和函數
<script src="../../resources/js/echarts/echarts.js">
</script> <script type="text/javascript">
var identity = 0;
var chart_bar;
require.config({ paths: { echarts: '../../resources/js/echarts' } });
require( [ 'echarts', 'echarts/chart/bar', ], DrawEChart );
function DrawEChart(ec)
{
chart_bar = ec.init(document.getElementById('mainBar1'));
Getdata();
}
function Getdata()
{ ption =
{
title: { text: '長者統計報表', subtext: '', x: 'center', y: 'top', zlevel: 0, textStyle: { fontSize: 18, fontWeight: 'bolder', color: '#333', } },
tooltip: { trigger: 'item' },
legend: { data: [], x: 'center', orient: 'horizontal', height: '100px', zlevel: 0, y: 'bottom', },
grid: { x: 80, y: 50, y2: 120, },
calculable: true,
xAxis: [ { type: 'category', data: [], } ],
yAxis: [ { type: 'value', axisLabel: { formatter: '{value} ' }, name:"總人數", } ],
series: []
};
//通過Ajax獲取數據
$.ajax({
async: false, //同步執行 url: 'SaHandler.ashx?t="相關參數, //這裡就用一般處理程序來處理數據,返回json格式
dataType: "json", //返回數據形式為json
type: "post",
success: function (result) {
if (result) {
if (result.series != "") {
chart_bar.clear();
option.legend.data = result.legend; //待返回
option.series = result.series; //待返回 這個地方返回有講究,因為你我需要把name,type,lable樣式全部從後台動態獲取,從而達到想要效果。具體看下面一般處理程序對返回數據的處理
option.xAxis[0].data = result.AgeList; //待返回
chart_bar.refresh(true);
} else { Ext.example.msg('', '該查詢條件沒有統計數據!'); }
}
}, error: function (errorMsg)
{
Ext.example.msg('提示', '不好意思,圖表請求數據失敗啦!');
} });
chart_bar.setOption(option);
</script>
第三步:一般處理程序處理數據,這個地方就要考慮了,你需要返回那些東西,根據api的案例你需要返回什麼樣格式或者類型數據。
在這裡 我需要返回 三個東西 圖表的legend,series 和xAxis。好吧 為了返回相應json格式字符串我們新建一個jsonhelp類(幫助返回Series使用)
public class SeriesJson {
/// <summary> /// sereis序列組id ///
</summary>
public int id { get; set; }
/// <summary> /// series序列組名稱 ///
</summary>
public string name { get; set; }
/// <summary> /// series序列組呈現圖表類型(line、column、bar等)
/// </summary>
public string type { get; set; }
/// <summary> /// series序列組的數據為數據類型數組 /// </summary>
public List<int> data { get; set; }
//這個是處理樣式的
public object itemStyle{get;set;} }
第四步就是做數據了,賦值然後輸出就ok了。
前台需要的,我們要返回的想定義好:(下面數據是亂寫的與運行效果圖數據不一致,僅供參考思路)
List<string> legend = new List<string>(){"測試一",“測試二”,“測試三”}; //源程序代碼太亂,隨便賦值了 但是要注意,實際項目中下面legend裡面的name需要保持一致才行。
List<string> AgeList = new List<string>() { "60歲及以下", "60-69歲", "70-99歲", };
List<SeriesJson> SeriesJosn = new List<SeriesJson>();
for(int i=0,i<=legend.length,i++){
SeriesJson json = new SeriesJson(); json.id = i; json.type = "bar"; json.data = new List<int>(){1,2,3}
json.name=legend[i];
json.itemStyle = new { normal = new { label = new { show = true, position = "top" } } };
}
}
var newObj = new { series = SeriesJosn, legend=legend, AgeList=AgeList, };
最後輸出:Output(JsonConvert.SerializeObject(newObj));
後台輸出,前台接收,ok,不出意外圖表就出來了。