在工作中經常會遇到需要將一組數據繪制成曲線圖的情況,最簡單的方法是將數據導入Excel,然後使用繪圖功能手動生成曲線圖。但是如果基礎數據頻繁更改,則手動創建圖形可能會變得枯燥乏味。本篇將利用DynamicDataDisplay 在WPF 中動態模擬CPU 使用率圖表,實現動態生成曲線圖。
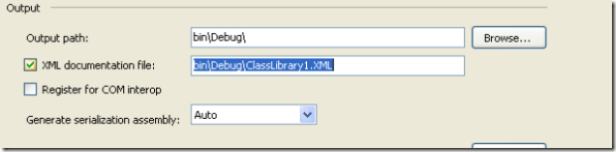
新建項目將DynamicDataDisplay.dll 加載到References 中,打開MainWindow.xaml 添加命名空間xmlns:d3="http://research.microsoft.com/DynamicDataDisplay/1.0"。通過<d3:ChartPlotter> 創建一個圖表框架,在其中添加兩條整型坐標軸,X軸:<d3:HorizontalIntegerAxis>,Y軸:<d3:VerticalIntegerAxis>。<d3:Header> 用來設置圖表名稱,<d3:VerticalAxisTitle> 用來設置Y軸名稱。
<Window x:Class="WpfPerformance.MainWindow"
xmlns="http://schemas.microsoft.com/winfx/2006/xaml/presentation"
xmlns:x="http://schemas.microsoft.com/winfx/2006/xaml"
xmlns:d3="http://research.microsoft.com/DynamicDataDisplay/1.0"
Title="CPU PerfZ喎?http://www.BkJia.com/kf/ware/vc/" target="_blank" class="keylink">vcm1hbmNl" Loaded="Window_Loaded" Height="350" Width="525">
<Grid>
<Grid.RowDefinitions>
<RowDefinition Height="Auto"/>
<RowDefinition Height="*"/>
</Grid.RowDefinitions>
<StackPanel Orientation="Horizontal">
<TextBlock Text="CPU Usage" Margin="20,10,0,0"
FontSize="15" FontWeight="Bold"/>
<TextBlock x:Name="cpuUsageText" Margin="10,10,0,0"
FontSize="15"/>
</StackPanel>
<d3:ChartPlotter x:Name="plotter" Margin="10,10,20,10" Grid.Row="1">
<d3:ChartPlotter.VerticalAxis>
<d3:VerticalIntegerAxis />
</d3:ChartPlotter.VerticalAxis>
<d3:ChartPlotter.HorizontalAxis>
<d3:HorizontalIntegerAxis />
</d3:ChartPlotter.HorizontalAxis>
<d3:Header Content="CPU Performance History"/>
<d3:VerticalAxisTitle Content="Percentage"/>
</d3:ChartPlotter>
</Grid>
</Window>

接下來工作需要通過C#每秒獲取一次CPU使用率,並將這些數據生成坐標點(Point)繪制在圖表中。 以下是MainWindow.xaml.cs 部分的代碼內容。
using System;
using System.Diagnostics;
using System.Windows;
using System.Windows.Media;
using System.Windows.Threading;
using Microsoft.Research.DynamicDataDisplay;
using Microsoft.Research.DynamicDataDisplay.DataSources;
namespace WpfPerformance
{
public partial class MainWindow : Window
{
private ObservableDataSource<Point> dataSource = new ObservableDataSource<Point>();
private PerformanceCounter cpuPerformance = new PerformanceCounter();
private DispatcherTimer timer = new DispatcherTimer();
private int i = 0;
public MainWindow()
{
InitializeComponent();
}
private void AnimatedPlot(object sender, EventArgs e)
{
cpuPerformance.CategoryName = "Processor";
cpuPerformance.CounterName = "% Processor Time";
cpuPerformance.InstanceName = "_Total";
double x = i;
double y = cpuPerformance.NextValue();
Point point = new Point(x, y);
dataSource.AppendAsync(base.Dispatcher, point);
cpuUsageText.Text = String.Format("{0:0}%", y);
i++;
}
private void Window_Loaded(object sender, RoutedEventArgs e)
{
plotter.AddLineGraph(dataSource, Colors.Green, 2, "Percentage");
timer.Interval = TimeSpan.FromSeconds(1);
timer.Tick += new EventHandler(AnimatedPlot);
timer.IsEnabled = true;
plotter.Viewport.FitToView();
}
}
} 通過ObservableDataSource<Point> 動態存儲圖表坐標點,PerformanceCounter 獲取CPU使用率數值,DispatcherTimer 計時器在規定間隔進行取數操作,整型i 作為CPU使用率坐標點的X軸數值。
private ObservableDataSource<Point> dataSource = new ObservableDataSource<Point>();
private PerformanceCounter cpuPerformance = new PerformanceCounter();
private DispatcherTimer timer = new DispatcherTimer();
private int i = 0; AnimatedPlot 事件用於構造坐標點,通過設置cpuPerformance 相關參數,並使用NextValue() 方法獲取當前CPU使用率數據作為Y值,整型i 作為X值。將X、Y值構造為坐標點(Point),並通過異步方式存儲在dataSource 中。
private void AnimatedPlot(object sender, EventArgs e)
{
cpuPer