該程序在屏幕上畫出指定的函數的圖像,函數的自變量的取值范圍由用戶指定,程序自動計算該區間內函數的值的取值范圍。首先,讓我們來看一幅正弦函數: f(x) = sin(x) 的圖像:
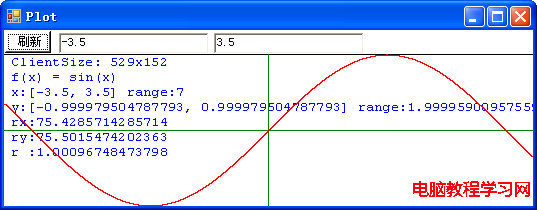
這幅圖像中,ClientSize: 529x152 表示該程序畫圖區寬度為 529 個像素,高度為 152 個像素。該函數自變量 x 的取值范圍從 -3.5 到 3.5,函數值 y 的取值范圍應該是從 -1 到 1,但因為浮點數運算誤差的關系,程序計算出來的是從 -0.999979504787793 到 0.999979504787793。接下來的 rx 表示函數自變量每單位值用多少個象素表示,ry 表示函數的值每單位值用多少個象素表示,r 值如果小於1表示圖形縱向被壓扁,反之則被拉伸。
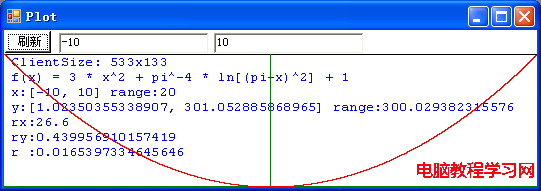
這是拋物線的圖像嗎?不,這就是我們要討論的病態函數: f(x) = 3 * x2 + π-4 * ln[(π-x)2] + 1 在 x 位於區間 [-10, 10] 之間的圖像。程序計算出來的函數在這區間的取值范圍是從 1.02350355338907 到 301.052885868965。r 值是 0.0165397334645646,表明該圖像被極大地壓扁,也就是,實際的圖像要高得多。但是,由於這個函數是病態的,程序的計算實際上是錯誤的,在該區間內,函數的最小值應該是負無窮大,並且,在 π - 10-667 到 π + 10-667 這一極小區間內方程 f(x) = 0 有兩個實根。讓我們在 π 值附近放大圖像看一看:
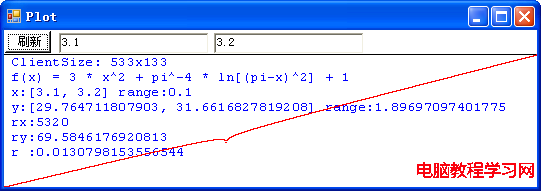
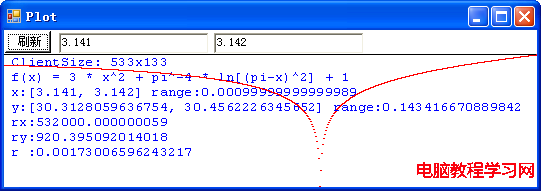
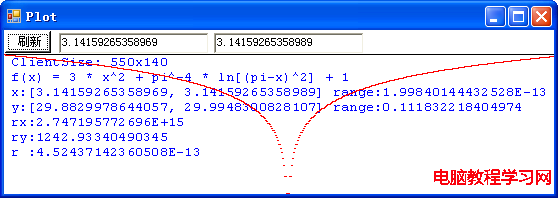
這下看得比較清楚了吧!
實際上這個病態函數是《C數值算法(第二版)》第三章“內插法和外推法”中提到的:
---------------------------------------------------------------------------
可以很容易地構造一些病態函數使內插法失敗。例如,考慮函數
f(x) = 3 * x2 + π-4 * ln[(π-x)2] + 1
它除了 x = π 之外都有定義,而 x = π 時無定義,其它情況,值有正有負。而這函數在任何基於數值 x = 3.13, 3.14, 3.15, 3.16 的插值法,都肯定在 x = 3.1416 處得到一個錯誤的解,盡管通過這五個點所畫的曲線確實相當平滑!(用計算器試試看。)
---------------------------------------------------------------------------
這個畫函數圖形的C#程序有一個嚴重的缺點,就是函數表達式是直接寫的源程序中的,不能象SciLab和Matlab那樣交互式地輸入。不知道用 System.Reflection.Emit.ILGenerator 類能不能動態地生成用戶輸入的函數表達式?好了,下面就是該程序的源代碼:

// plot.cs: 畫函數圖形, 編譯方法: csc /t:winexe plot.cs
using System;
using System.Drawing;
using System.
Windows.Forms;
namespace Skyiv.Ben.Plot


{

sealed class PlotForm : Form


{
// 要畫的函數,如果能在 TextBox 中輸入函數的表達式就更好了
double Function(double x)
{
double u = Math.PI - x;
double pi2 = Math.PI * Math.PI;
return 3 * x * x + Math.Log(u * u) / pi2 / pi2 + 1;

}
// 僅僅用來顯示在屏幕上
string FunctionString()
{
return "f(x) = 3 * x^2 + pi^-4 * ln[(pi-x)^2] + 1";
}
const int yBase = 24; // 屏幕保留區域的高度
TextBox tbxX0, tbxX1; // 函數自變量的取值范圍
PlotForm()
{
SuspendLayout();
Button btnSubmit = new Button();
btnSubmit.Text = "刷新";
btnSubmit.Location = new Point(0, 0);
btnSubmit.Size = new Size(48, 24);
btnSubmit.Click += new EventHandler(BtnSubmit_Click);
tbxX0 = new TextBox();
tbxX0.Text = "-10";
tbxX0.Location = new Point(55, 3);
tbxX0.Size = new Size(150, 20);
tbxX1 = new TextBox();
tbxX1.Text = "10";
tbxX1.Location = new Point(210, 3);
tbxX1.Size = new Size(150, 20);
Controls.AddRange(new Control[]
{btnSubmit, tbxX0, tbxX1});
Text = "Plot";
BackColor = Color.White;
ClientSize = new Size(600, 600 + yBase);
// WindowState = FormWindowState.Maximized;
ResumeLayout(false);
}
void BtnSubmit_Click(object sender, EventArgs e)
{
Invalidate();
}
protected override void OnSizeChanged(EventArgs e)
{
Invalidate();
base.OnSizeChanged(e);
}
protected override void OnPaint(PaintEventArgs e)
{
double x0 = double.Parse(tbxX0.Text);
double x1 = double.Parse(tbxX1.Text);
Graphics gc = e.Graphics;
Size size = ClientSize;
int i0 = 0;
int i1 = size.Width - 1;
int j0 = yBase;
int j1 = size.Height - 1;
Pen pen = new Pen(Color.Black, 1);
gc.DrawLine(pen, i0, j0, i1, j0); // 畫圖區和保留區的分界線
double rx = (x1 - x0) / (i1 - i0);
double y0, y1;
GetFunctionValueRange(x0, rx, i0, i1, out y0, out y1);
double ry = (y1 - y0) / (j1 - j0);
Out(gc, 0, "ClientSize: {0}x{1}", i1 - i0 + 1, j1 - j0 + 1);
Out(gc, 1, FunctionString());
Out(gc, 2, "x:[{0}, {1}] range:{2}", x0, x1, x1 - x0);
Out(gc, 3, "y:[{0}, {1}] range:{2}", y0, y1, y1 - y0);
Out(gc, 4, "rx:{0}", 1 / rx); // 函數自變量每單位值用多少個象素表示
Out(gc, 5, "ry:{0}", 1 / ry); // 函數的值每單位值用多少個象素表示
Out(gc, 6, "r :{0}", rx / ry); // 該值如果小於1表示圖形縱向被壓扁,反之則被拉伸
pen.Color = Color.Green;
int j = j1 + (int)(y0 / ry);
if (j >= j0 && j <= j1) gc.DrawLine(pen, i0, j, i1, j); // x坐標軸
int i = i0 - (int)(x0 / rx);
if (i >= i0 && i <= i1) gc.DrawLine(pen, i, j0, i, j1); // y坐標軸
pen.Color = Color.Red;
for (i = i0; i <= i1; i++)
{
double x = x0 + (i - i0) * rx;
double y = Function(x);
if (double.IsInfinity(y) || double.IsNaN(y)) continue;
j = j1 - (int)((y - y0) / ry);
if (j > j1 || j < j0) continue;
gc.DrawLine(pen, i, j, i + 1, j); // 畫函數的圖形
}
base.OnPaint(e);
}
// 函數值的取值范圍
void GetFunctionValueRange(double x0, double rx, int i0, int i1, out double y0, out double y1)
{
y0 = double.MaxValue;
y1 = double.MinValue;
for (int i = i0; i <= i1; i++)
{
double x = x0 + (i - i0) * rx;
double y = Function(x);
if (double.IsInfinity(y) || double.IsNaN(y)) continue;
if (y0 > y) y0 = y;
if (y1 < y) y1 = y;
}
}
// 在指定的位置寫字符串
void Out(Graphics gc, int line, string fmt, params object [] args)
{
gc.DrawString(string.Format(fmt, args), new Font("Courier New", 10), Brushes.Blue, new PointF(5, yBase + 15 * line));
}
static void Main()
{
Application.Run(new PlotForm());
}
}

}