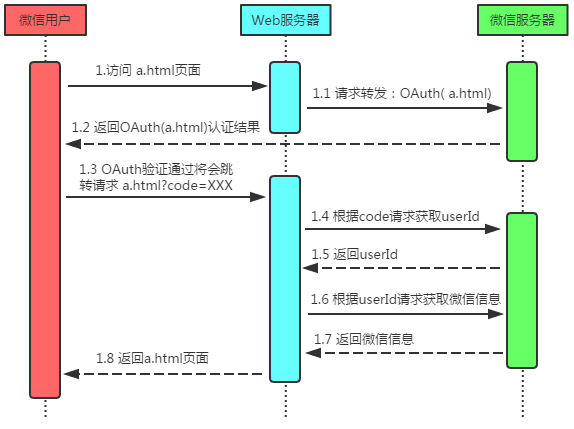
基於一組與測試有關的數據來生成圖形是一項常見的軟件開發任務。根據我的經驗,最常用 的方法是將數據導入 Excel 電子表格,然後使用 Excel 內置的繪圖功能手動生成圖形。這種 做法適用於大多數情況,但是如果基礎數據頻繁更改,則手動創建圖形可能很快就變得枯燥乏 味。在本月的專欄中,我將向您演示如何使用 Windows Presentation Foundation (WPF) 技術 自動執行該過程。若要了解我所闡述的觀點,請看圖 1。該圖按日期顯示打開和已關閉的錯誤 的計數,是使用從簡單文本文件讀取數據的一個短小 WPF 程序動態生成的。
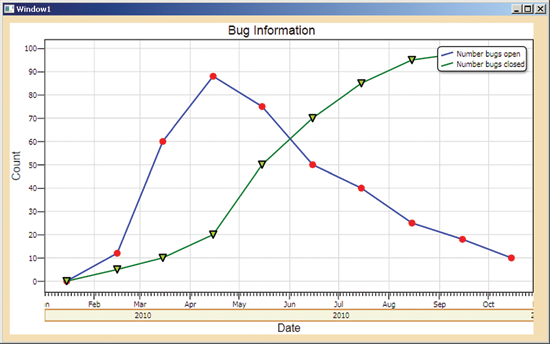
圖 1 以編程方式生成的錯誤計數圖
打開的錯誤(用藍色線條上的紅圈表示)在開發工作開始後不久迅速增多,然後隨時間推移 逐漸減少(這是在估計零錯誤反彈日期時可能十分有用的信息)。已關閉的錯誤(綠色線條上 的三角形標記)則穩步增多。
雖然這些信息可能十分有用,但在生產環境中,開發資源通常是有限的,因此手動生成這類 圖形可能不太值得。但是使用我將說明的技術,可快速而輕松地創建這類圖形。
在下面幾節中,我將詳細展示和說明用於生成圖 1 中圖形的 C# 代碼。本專欄假設您已具 備 C# 編碼方面的中級知識,並對 WPF 有最基本的了解。不過,即使您從前沒有接觸過這兩個 領域,我認為您也能夠理解我所討論的內容。我相信您會發現這項技術對於您的綜合技能是個 有趣且有用的補充。
建立項目
我首先啟動 Visual Studio 2008,並使用 WPF 應用程序模板新建一個 C# 項目。從“新建 項目”對話框右上方區域的下拉控件中選擇 .NET Framework 3.5 庫。將項目命名為 BugGraph 。雖然您可以使用 WPF 基元以編程方式生成圖形,但我使用了方便的 DynamicDataDisplay 庫 (由 Microsoft 研究院實驗室開發)。
您可以從位於 codeplex.com/dynamicdatadisplay 的 CodePlex 開源托管站點下載該庫。 我將副本保存在 BugGraph 項目的根目錄中,然後右鍵單擊項目名稱,選擇“添加引用”選項 並指向根目錄中的 DLL 文件,從而在項目中添加對 DLL 的引用。
接下來創建源數據。在生產環境中,您的數據可以位於 Excel 電子表格、SQL 數據庫或 XML 文件中。為簡單起見,我使用簡單文本文件。在 Visual Studio 解決方案資源管理器窗口 中,右鍵單擊項目名稱,然後從上下文菜單中選擇“添加”|“新建項”。然後選擇“文本文件 ”項,將文件重命名為 BugInfo.txt,並單擊“添加”按鈕。下面是虛擬數據:
01/15/2010:0:0

02/15/2010:12:5

03/15/2010:60:10

04/15/2010:88:20

05/15/2010:75:50

06/15/2010:50:70

07/15/2010:40:85

08/15/2010:25:95

09/15/2010:18:98

10/15/2010:10:99
每行中的第一個冒號分隔字段包含一個日期,第二個字段包含關聯日期的打開錯誤數,第三 個字段顯示已關閉錯誤數。正如稍後您將看到的那樣,DynamicDataDisplay 庫可以處理大多數 類型的數據。
接下來,我雙擊 Window1.xaml 文件,以加載項目的 UI 定義。添加對繪圖庫 DLL 的引用 ,並對 WPF 顯示區域的默認 Width、Height 和 Background 特性稍加修改,如下所示:
xmlns:d3="http://research.microsoft.com/DynamicDataDisplay/1.0"

Title="Window1" WindowState="Normal" Height="500" Width="800"  Background="Wheat">
然後,添加關鍵的繪圖對象,如圖 2 所示。
圖 2 添加關鍵的繪圖對象
<d3:ChartPlotter Name="plotter" Margin="10,10,20,10">

  <d3:ChartPlotter.HorizontalAxis>

   <d3:HorizontalDateTimeAxis Name="dateAxis"/>

  </d3:ChartPlotter.HorizontalAxis>

  <d3:ChartPlotter.VerticalAxis>

   <d3:VerticalIntegerAxis Name="countAxis"/>

  </d3:ChartPlotter.VerticalAxis>


  <d3:Header FontFamily="Arial" Content="Bug Information"/>

  <d3:VerticalAxisTitle FontFamily="Arial" Content="Count"/>

  <d3:HorizontalAxisTitle FontFamily="Arial" Content="Date"/>

</d3:ChartPlotter>
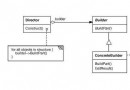
ChartPlotter 元素是主要顯示對象。在該元素的定義中,我添加了水平日期軸和垂直整數 軸的聲明。DynamicDataDisplay 庫的默認軸類型是具有小數部分的數字(在 C# 術語中稱為 double 類型);該類型無需顯式軸聲明。我還添加了一個標頭標題聲明和軸標題聲明。圖 3 顯示迄今為止的設計。
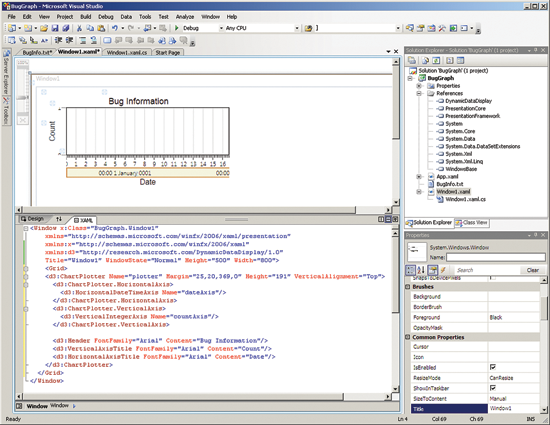
圖 3 BugGraph 程序設計
轉到源代碼
配置了項目的靜態內容後,便已准備就緒,可以添加用於讀取源數據並以編程方式生成圖形 的代碼。在解決方案資源管理器窗口中雙擊 Window1.xaml.cs 文件,以將該 C# 文件加載到代 碼編輯器中。圖 4 列出了生成圖 1 中圖形的程序的完整源代碼。
圖 4 BugGraph 項目的源代碼
using System;

using System.Collections.Generic;

using System.Windows;

using System.Windows.Media; // Pen


using System.IO;

using Microsoft.Research.DynamicDataDisplay; // Core functionality

using Microsoft.Research.DynamicDataDisplay.DataSources; //  EnumerableDataSource

using Microsoft.Research.DynamicDataDisplay.PointMarkers; //  CirclePointMarker


namespace BugGraph

{

  public partial class Window1 : Window

  {

   public Window1()

   {

    InitializeComponent();

    Loaded += new RoutedEventHandler(Window1_Loaded);

   }


   private void Window1_Loaded(object sender, RoutedEventArgs e)

   {

    List<BugInfo> bugInfoList = LoadBugInfo ("..\\..\\BugInfo.txt");


    DateTime[] dates = new DateTime[bugInfoList.Count];

    int[] numberOpen = new int[bugInfoList.Count];

    int[] numberClosed = new int[bugInfoList.Count];


    for (int i = 0; i < bugInfoList.Count; ++i)

    {

     dates[i] = bugInfoList[i].date;

     numberOpen[i] = bugInfoList[i].numberOpen;

     numberClosed[i] = bugInfoList[i].numberClosed;

    }


    var datesDataSource = new EnumerableDataSource<DateTime> (dates);

    datesDataSource.SetXMapping(x => dateAxis.ConvertToDouble (x));


    var numberOpenDataSource = new EnumerableDataSource<int> (numberOpen);

    numberOpenDataSource.SetYMapping(y => y);


    var numberClosedDataSource = new EnumerableDataSource<int> (numberClosed);

    numberClosedDataSource.SetYMapping(y => y);


    CompositeDataSource compositeDataSource1 = new

     CompositeDataSource(datesDataSource, numberOpenDataSource);

    CompositeDataSource compositeDataSource2 = new

     CompositeDataSource(datesDataSource, numberClosedDataSource);


    plotter.AddLineGraph(compositeDataSource1,

     new Pen(Brushes.Blue, 2),

     new CirclePointMarker { Size = 10.0, Fill = Brushes.Red },

     new PenDescription("Number bugs open"));


    plotter.AddLineGraph(compositeDataSource2,

     new Pen(Brushes.Green, 2),

     new TrianglePointMarker { Size = 10.0,

      Pen = new Pen(Brushes.Black, 2.0),

       Fill = Brushes.GreenYellow },

     new PenDescription("Number bugs closed"));


    plotter.Viewport.FitToView();


   } // Window1_Loaded()


   private static List<BugInfo> LoadBugInfo(string fileName)

   {

    var result = new List<BugInfo>();

    FileStream fs = new FileStream(fileName, FileMode.Open);

    StreamReader sr = new StreamReader(fs);


    string line = "";

    while ((line = sr.ReadLine()) != null)

    {

     string[] pieces = line.Split(':');

     DateTime d = DateTime.Parse(pieces[0]);

     int numopen = int.Parse(pieces[1]);

     int numclosed = int.Parse(pieces[2]);

     BugInfo bi = new BugInfo(d, numopen, numclosed);

     result.Add(bi);

    }

    sr.Close();

    fs.Close();

    return result;

   }


  } // class Window1


  public class BugInfo {

  public DateTime date;

  public int numberOpen;

  public int numberClosed;


  public BugInfo(DateTime date, int numberOpen, int numberClosed) {

   this.date = date;

   this.numberOpen = numberOpen;

   this.numberClosed = numberClosed;

  }


}} // ns
我刪除了 Visual Studio 模板生成的不必要的 using 命名空間語句(如 System.Windows.Shapes)。然後向 DynamicDataDisplay 庫中的三個命名空間添加了 using 語句,從而不必完全限定其名稱。接下來,在 Window1 構造函數中為程序定義的主例程添加一 個事件:
Loaded += new RoutedEventHandler(Window1_Loaded);
下面是該主例程的開頭部分:
private void Window1_Loaded(object sender, RoutedEventArgs e)

{

  List<BugInfo> bugInfoList = LoadBugInfo("..\\..\\BugInfo.txt");

  ...
我聲明了一個泛型列表對象 bugInfoList,並使用一個程序定義的幫助器方法(名為 LoadBugInfo)將文件 BugInfo.txt 中的虛擬數據填充到該列表中。為了組織我的錯誤信息, 我聲明了一個小幫助器類 BugInfo,如圖 5 所示。
圖 5 幫助器類 BugInfo
public class BugInfo {

  public DateTime date;

  public int numberOpen;

  public int numberClosed;


  public BugInfo(DateTime date, int numberOpen, int numberClosed) {

   this.date = date;

   this.numberOpen = numberOpen;

   this.numberClosed = numberClosed;

  }

}
為簡單起見,我將三個數據字段聲明為公共類型,而不是聲明為與 get 和 set 屬性相結合 的私有類型。因為 BugInfo 只是數據,所以我可以使用 C# 結構而不使用類。LoadBugInfo 方 法打開 BugInfo.txt 文件並遍歷該文件,分析每個字段,然後實例化 BugInfo 對象,並將每 個 BugInfo 對象存儲到結果列表中,如圖 6 所示。
圖 6 LoadBugInfo 方法
private static List<BugInfo> LoadBugInfo(string fileName)

{

  var result = new List<BugInfo>();

  FileStream fs = new FileStream(fileName, FileMode.Open);

  StreamReader sr = new StreamReader(fs);


  string line = "";

  while ((line = sr.ReadLine()) != null)

  {

   string[] pieces = line.Split(':');

   DateTime d = DateTime.Parse(pieces[0]);

   int numopen = int.Parse(pieces[1]);

   int numclosed = int.Parse(pieces[2]);

   BugInfo bi = new BugInfo(d, numopen, numclosed);

   result.Add(bi);

  }

  sr.Close();

  fs.Close();

  return result;

}
我可以使用 File.ReadAllLines 方法將數據文件中的所有行讀入一個字符串數組,而不是 讀取並處理該文件中的每一行。請注意,為了使代碼短小、清晰,我省略了常規的錯誤檢查步 驟,但您在生產環境中應執行該檢查。
接下來,我對三個數組進行聲明並賦值,如圖 7 所示。
圖 7 構建數組
DateTime[] dates = new DateTime[bugInfoList.Count];

  int[] numberOpen = new int[bugInfoList.Count];

  int[] numberClosed = new int[bugInfoList.Count];


  for (int i = 0; i < bugInfoList.Count; ++i)

  {

   dates[i] = bugInfoList[i].date;

   numberOpen[i] = bugInfoList[i].numberOpen;

   numberClosed[i] = bugInfoList[i].numberClosed;

  }

  ...
使用 DynamicDataDisplay 庫時,將顯示數據組織為一維數組集通常很方便。作為我的程序 設計(即將數據讀入一個列表對象,然後將列表數據傳輸到數組)的替代方法,我可以將數據 直接讀入數組。
接下來,我將數據數組轉換為特殊的 EnumerableDataSource 類型:
var datesDataSource = new EnumerableDataSource<DateTime> (dates);

datesDataSource.SetXMapping(x => dateAxis.ConvertToDouble(x));


var numberOpenDataSource = new EnumerableDataSource<int> (numberOpen);

numberOpenDataSource.SetYMapping(y => y);


var numberClosedDataSource = new EnumerableDataSource<int> (numberClosed);

numberClosedDataSource.SetYMapping(y => y);

...
對於 DynamicDataDisplay 庫,要繪制的所有數據都必須為統一格式。我只是將三個數據數 組傳遞給泛型 EnumerableDataSource 構造函數。此外,必須告知該庫與每個數據源關聯的軸 (x 軸或 y 軸)。SetXMapping 和 SetYMapping 方法接受將方法委托作為參數。我使用了 lambda 表達式來創建匿名方法,而不是定義顯式委托。DynamicDataDisplay 庫的基本軸數據 類型是 double。SetXMapping 和 SetYMapping 方法將我的特殊數據類型映射到 double 類型 。
在 x 軸上,我使用 ConvertToDouble 方法將 DateTime 數據顯式轉換為 double 類型。在 y 軸上,我只是編寫 y => y(讀作“y 轉為 y”),將輸入 int y 隱式轉換為輸出 double y。我也可以通過編寫 SetYMapping(y => Convert.ToDouble(y) 來顯式進行類型映 射。我可以任意選擇 x 和 y 作為 lambda 表達式的參數,即,我可以使用任意參數名稱。
下一步是組合 x 軸和 y 軸數據源:
CompositeDataSource compositeDataSource1 = new

  CompositeDataSource(datesDataSource, numberOpenDataSource);


CompositeDataSource compositeDataSource2 = new

  CompositeDataSource(datesDataSource, numberClosedDataSource);


...
圖 1 中的屏幕截圖顯示了在同一個圖形中繪制的兩個數據系列,即打開的錯誤數和已關閉 的錯誤數。每個復合數據源定義一個數據系列,因此,我在此處需要兩個單獨的數據源:一個 用於打開的錯誤數,一個用於已關閉的錯誤數。當數據全都准備好時,實際上只需一條語句便 可繪制數據點:
plotter.AddLineGraph(compositeDataSource1,

  new Pen(Brushes.Blue, 2),

  new CirclePointMarker { Size = 10.0, Fill = Brushes.Red },

  new PenDescription("Number bugs open"));


...
AddLineGraph 方法接受 CompositeDataSource,後者定義要繪制的錯誤以及有關確切的繪 制方式的信息。此處,我指示名為 plotter 的繪圖器對象(在 Window1.xaml 文件中定義)執 行以下操作:使用粗細為 2 的藍色線條繪制一個圖形,放置具有紅色邊框和紅色填充且大小為 10 的圓圈標記,並添加系列標題 Number bugs open。太巧妙了!作為許多備選方法中的一種 ,我可以使用
plotter.AddLineGraph(compositeDataSource1, Colors.Red, 1, "Number Open")
來繪制不帶標記的細紅色線條。或者,我也可以創建虛線而不是實線:
Pen dashedPen = new Pen(Brushes.Magenta, 3);

dashedPen.DashStyle = DashStyles.DashDot;

plotter.AddLineGraph(compositeDataSource1, dashedPen,

  new PenDescription("Open bugs"));
我的程序最後會繪制第二個數據系列:
...

   plotter.AddLineGraph(compositeDataSource2,

   new Pen(Brushes.Green, 2),

   new TrianglePointMarker { Size = 10.0,

    Pen = new Pen(Brushes.Black, 2.0),

    Fill = Brushes.GreenYellow },

   new PenDescription("Number bugs closed"));


  plotter.Viewport.FitToView();


} // Window1_Loaded()
此處,我指示繪圖器使用帶有三角形標記的綠色線條,這些三角形標記具有黑色邊框和黃綠 色填充。FitToView 方法將圖形縮放為 WPF 窗口的大小。
指示 Visual Studio 生成 BugGraph 項目後,我獲得 BugGraph.exe 可執行文件,可以隨 時以手動方式或編程方式啟動該文件。我只需編輯 BugInfo.txt 文件就可更新基礎數據。因為 整個系統基於 .NET Framework 代碼,所以我可將繪圖功能輕松地集成到任何 WPF 項目中,而 不必處理跨技術問題。DynamicDataDisplay 庫還有一個 Silverlight 版本,因此我也可以向 Web 應用程序中添加編程繪圖功能。
散點圖
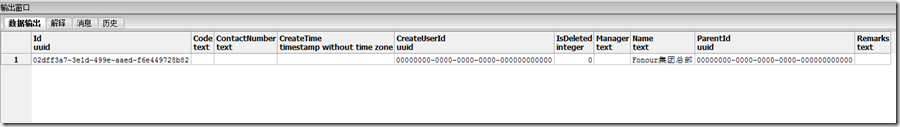
前一節中展示的技術可以應用於所有類型的數據,而不僅是與測試相關的數據。我們來簡單 了解一下另一個簡單但令人印象相當深刻的示例。圖 8 中的屏幕截圖顯示了 13,509 個美國城 市。
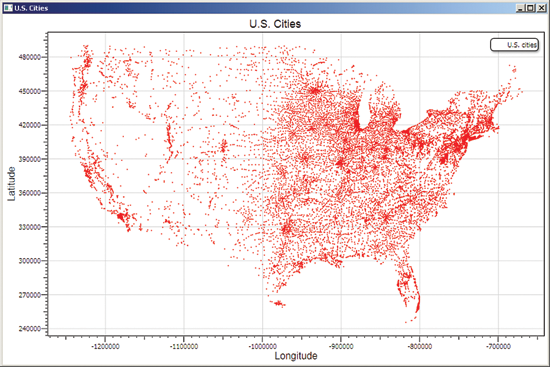
圖 8 散點圖示例
您可能可以識別出福羅裡達州、德克薩斯州、南加利福尼亞州以及五大湖的位置。我從一個 庫獲得了該散點圖的數據,該庫中的數據旨在用於旅行商問題 (www.iwr.uni- heidelberg.de/groups/comopt/software/TSPLIB95),這在計算機科學領域是一個最有名且廣 為研究的主題之一。我使用的文件 usa13509.tsp.gz 類似於:
NAME : usa13509

(other header information)

1 245552.778 817827.778

2 247133.333 810905.556

3 247205.556 810188.889

...


13507 489663.889 972433.333

13508 489938.889 1227458.333

13509 490000.000 1222636.111
第一個字段是從 1 開始的索引 ID。第二個和第三個字段表示從具有 500 或更多人口的美 國城市的緯度和經度派生而來的坐標。我按照前一節中所述創建了一個新 WPF 應用程序,向項 目中添加了一個文本文件項,並將城市數據復制到該文件中。我在數據文件的標頭行前面添加 了雙斜槓 (//) 字符,從而注釋掉這些行。
若要創建圖 8 中所示的散點圖,我只需對前一節中展示的示例稍加更改即可。我修改了 MapInfo 類成員,如下所示:
public int id;

  public double lat;

  public double lon;
圖 9 顯示了修改後的 LoadMapInfo 方法中的關鍵處理循環。
圖 9 散點圖的循環
while ((line = sr.ReadLine()) != null)

{

  if (line.StartsWith("//"))

   continue;

  else {

   string[] pieces = line.Split(' ');

   int id = int.Parse(pieces[0]);

   double lat = double.Parse(pieces[1]);

   double lon = -1.0 * double.Parse(pieces[2]);

   MapInfo mi = new MapInfo(id, lat, lon);

   result.Add(mi);

  }

}
我讓代碼檢查當前行是否以程序定義的注釋標記開頭,如果是,則跳過該行。請注意,我將 經度派生的字段乘以 -1.0,因為經度在 x 軸方向上是從東向西(或從右向左)。如果不使用 -1.0 因子,則我的地圖將是正確方向的鏡像圖像。
我填充原始數據數組時,只需確保將緯度和經度分別與 y 軸和 x 軸關聯即可:
for (int i = 0; i < mapInfoList.Count; ++i)

{

  ids[i] = mapInfoList[i].id;

  xs[i] = mapInfoList[i].lon;

  ys[i] = mapInfoList[i].lat;

}
如果我顛倒關聯順序,則產生的地圖會沿其邊緣傾斜。當我繪制數據時,只需要稍微調整一 下便可創建散點圖而不是折線圖:
plotter.AddLineGraph(compositeDataSource,

  new Pen(Brushes.White, 0),

  new CirclePointMarker { Size = 2.0, Fill = Brushes.Red },

  new PenDescription("U.S. cities"));
通過向 Pen 構造函數傳遞 0 值,我指定了一根寬度為 0 的線條,這可有效地刪除該線條 ,從而創建散點圖而不是折線圖。產生的圖形效果很棒,而且只需要幾分鐘就可編寫出生成該 圖形的程序。相信我,我嘗試過其他很多種方法來繪制地理數據,將 WPF 和 DynamicDataDisplay 庫結合使用是我找到的最好的解決方案之一。
輕松繪圖
我在此處展示的技術可用於以編程方式生成圖形。該技術的關鍵是 Microsoft 研究院提供 的 DynamicDataDisplay 庫。如果在軟件生產環境中用作獨立技術來生成圖形,則該方法在基 礎數據頻繁更改時最為有用。如果在應用程序中用作集成技術來生成圖形,則該方法對於 WPF 或 Silverlight 應用程序最為有用。隨著這兩種技術的演變,我確信將會看到更多基於這兩種 技術的優秀視覺顯示庫。