ZedGraph版本:5.1.4
開發環境:.net2.0,vs2008
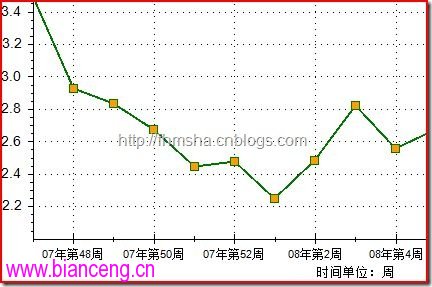
在它的內置對象中,linechar對象的x軸的值是跟隨值變化的,但是在以周為x軸坐標時,當遇到跨年的問題時,問題就來了,我們希望
50,51,52,1,2,3,4的排列,但是如果這樣賦值的話,zedgraph會按照值的大小把其排序:
1,2,3,4,50,51,52
當然不能讓這樣的事情發生,所以我用了一個絕對的周數來做x軸:
50,51,52,53,54,55,56
但是這樣一來,看圖片的用戶就會很郁悶的去轉換你的絕對周到底是相對於哪一年的哪一周。
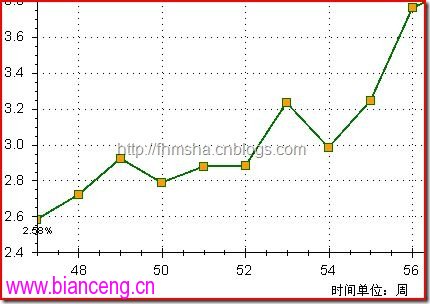
格式化X軸文本zedgraph只提供了一種方法,我們可以給它加上“周”這個字:
myPane.XAxis.Scale.Format = "0周";
沒有效果圖,湊合一個Y軸的來看看(myPane.YAxis.Scale.Format = "第0名";):
但是這並不能把顯示出來的53周轉換成1周,於是想到了去改源代碼:
1,在Type.cs中
public enum AxisType
public enum AxisType
  {
    /**//// <summary> An ordinary, cartesian axis </summary>
    Linear,
    /**//// <summary> A base 10 log axis </summary>
    Log,
    /**//// <summary> A cartesian axis with calendar dates or times </summary>
    Date,
    /**//// <summary> An ordinal axis with user-defined text labels. An ordinal axis means that
    /// all data points are evenly spaced at integral values, and the actual coordinate values
    /// for points corresponding to that axis are ignored. That is, if the X axis is an
    /// ordinal type, then all X values associated with the curves are ignored.</summary>
    /// <seealso cref="AxisType.Ordinal"/>
    /// <seealso cref="Scale.IsText"/>
    /// <seealso cref="ZedGraph.Scale.Default.MaxTextLabels"/>
    Text,
    /**//// <summary> An ordinal axis with regular numeric labels. An ordinal axis means that
    /// all data points are evenly spaced at integral values, and the actual coordinate values
    /// for points corresponding to that axis are ignored. That is, if the X axis is an
    /// ordinal type, then all X values associated with the curves are ignored. </summary>
    /// <seealso cref="AxisType.Text"/>
    /// <seealso cref="Scale.IsOrdinal"/>
    Ordinal,
    /**//// <summary> An ordinal axis that will have labels formatted with ordinal values corresponding
    /// to the number of values in each <see cref="CurveItem" />.
    /// </summary>
    /// <remarks>
    /// The <see cref="CurveItem" /> data points will be evenly-spaced at ordinal locations, and the
    /// actual data values are ignored. </remarks>
    /// <seealso cref="AxisType.Text"/>
    /// <seealso cref="Scale.IsOrdinal"/>
    DateAsOrdinal,
    /**//// <summary> An ordinal axis that will have labels formatted with values from the actual data
    /// values of the first <see cref="CurveItem" /> in the <see cref="CurveList" />.
    /// </summary>
    /// <remarks>
    /// Although the tics are labeled with real data values, the actual points will be
    /// evenly-spaced in spite of the data values. For example, if the X values of the first curve
    /// are 1, 5, and 100, then the tic labels will show 1, 5, and 100, but they will be equal
    /// distance from each other. </remarks>
    /// <seealso cref="AxisType.Text"/>
    /// <seealso cref="Scale.IsOrdinal"/>
    LinearAsOrdinal,
    /**//// <summary> An exponential axis </summary>
    Exponent,
    /**//// <summary>
    /// add
    /// </summary>
    Weekly
  }
枚舉類型中添加一個新類型Weekly:
2,在Scale.cs文件中,MakeNewScale方法中添加實例化的分支:
MakeNewScale
public Scale MakeNewScale( Scale oldScale, AxisType type )
    {
      switch ( type )
      {
        case AxisType.Linear:
          return new LinearScale( oldScale, _ownerAxis );
        case AxisType.Date:
          return new DateScale( oldScale, _ownerAxis );
        case AxisType.Log:
          return new LogScale( oldScale, _ownerAxis );
        case AxisType.Exponent:
          return new ExponentScale( oldScale, _ownerAxis );
        case AxisType.Ordinal:
          return new OrdinalScale( oldScale, _ownerAxis );
        case AxisType.Text:
          return new TextScale( oldScale, _ownerAxis );
        case AxisType.DateAsOrdinal:
          return new DateAsOrdinalScale( oldScale, _ownerAxis );
        case AxisType.LinearAsOrdinal:
          return new LinearAsOrdinalScale( oldScale, _ownerAxis );
        case AxisType .Weekly :
          return new WeeklyScale(oldScale, _ownerAxis);
        default:
          throw new Exception( "Implementation Error: Invalid AxisType" );
      }
    }
3,添加WeeklyScale.cs文件,內容如下:
//============================================================================
//ZedGraph Class Library - A Flexible Line Graph/Bar Graph Library in C#
//Copyright ?2005  John Champion
//
//This library is free software; you can redistribute it and/or
//modify it under the terms of the GNU Lesser General Public
//License as published by the Free Software Foundation; either
//version 2.1 of the License, or (at your option) any later version.
//
//This library is distributed in the hope that it will be useful,
//but WITHOUT ANY WARRANTY; without even the implied warranty of
//MERCHANTABILITY or FITNESS FOR A PARTICULAR PURPOSE.  See the GNU
//Lesser General Public License for more details.
//
//You should have received a copy of the GNU Lesser General Public
//License along with this library; if not, write to the Free Software
//Foundation, Inc., 59 Temple Place, Suite 330, Boston, MA  02111-1307  USA
//=============================================================================
using System;
using System.Collections;
using System.Text;
using System.Drawing;
using System.Runtime.Serialization;
using System.Security.Permissions;
namespace ZedGraph
{
    /**//// <summary>
    /// The WeeklyScale class inherits from the <see cref="Scale" /> class, and implements
    /// the features specific to <see cref="AxisType.Weekly" />.
    /// </summary>
    /// <remarks>
    /// Weekly is an ordinal axis that will have labels formatted with values from the actual data
    /// values of the first <see cref="CurveItem" /> in the <see cref="CurveList" />.
    /// Although the tics are labeled with real data values, the actual points will be
    /// evenly-spaced in spite of the data values.  For example, if the X values of the first curve
    /// are 1, 5, and 100, then the tic labels will show 1, 5, and 100, but they will be equal
    /// distance from each other.
    /// </remarks>
    ///
    /// <author> John Champion  </author>
    /// <version> $Revision: 1.10 $ $Date: 2007/04/16 00:03:02 $ </version>
    [Serializable]
    class WeeklyScale : Scale, ISerializable //, ICloneable
    {
        constructors#region constructors
        /**//// <summary>
        /// Default constructor that defines the owner <see cref="Axis" />
        /// (containing object) for this new object.
        /// </summary>
        /// <param name="owner">The owner, or containing object, of this instance</param>
        public WeeklyScale(Axis owner)
            : base(owner)
        {
        }
        /**//// <summary>
        /// The Copy Constructor
        /// </summary>
        /// <param name="rhs">The <see cref="WeeklyScale" /> object from which to copy</param>
        /// <param name="owner">The <see cref="Axis" /> object that will own the
        /// new instance of <see cref="WeeklyScale" /></param>
        public WeeklyScale(Scale rhs, Axis owner)
            : base(rhs, owner)
        {
        }
        /**//// <summary>
        /// Create a new clone of the current item, with a new owner assignment
        /// </summary>
        /// <param name="owner">The new <see cref="Axis" /> instance that will be
        /// the owner of the new Scale</param>
        /// <returns>A new <see cref="Scale" /> clone.</returns>
        public override Scale Clone(Axis owner)
        {
            return new WeeklyScale(this, owner);
        }
        #endregion
        properties#region properties
        /**//// <summary>
        /// Return the <see cref="AxisType" /> for this <see cref="Scale" />, which is
        /// <see cref="AxisType.Weekly" />.
        /// </summary>
        public override AxisType Type
        {
            get { return AxisType.Weekly; }
        }
        #endregion
        methods#region methods
        /**//// <summary>
        /// Select a reasonable ordinal axis scale given a range of data values, with the expectation that
        /// linear values will be displayed.
        /// </summary>
        /// <remarks>
        /// This method only applies to <see cref="AxisType.DateAsOrdinal"/> type axes, and it
        /// is called by the general <see cref="Scale.PickScale"/> method.  For this type,
        /// the first curve is the "master", which contains the dates to be applied.
        /// <para>On Exit:</para>
        /// <para><see cref="Scale.Min"/> is set to scale minimum (if <see cref="Scale.MinAuto"/> = true)</para>
        /// <para><see cref="Scale.Max"/> is set to scale maximum (if <see cref="Scale.MaxAuto"/> = true)</para>
        /// <para><see cref="Scale.MajorStep"/> is set to scale step size (if <see cref="Scale.MajorStepAuto"/> = true)</para>
        /// <para><see cref="Scale.MinorStep"/> is set to scale minor step size (if <see cref="Scale.MinorStepAuto"/> = true)</para>
        /// <para><see cref="Scale.Mag"/> is set to a magnitude multiplier according to the data</para>
        /// <para><see cref="Scale.Format"/> is set to the display format for the values (this controls the
        /// number of decimal places, whether there are thousands separators, currency types, etc.)</para>
        /// </remarks>
        /// <param name="pane">A reference to the <see cref="GraphPane"/> object
        /// associated with this <see cref="Axis"/></param>
        /// <param name="g">
        /// A graphic device object to be drawn into.  This is normally e.Graphics from the
        /// PaintEventArgs argument to the Paint() method.
        /// </param>
        /// <param name="scaleFactor">
        /// The scaling factor to be used for rendering objects.  This is calculated and
        /// passed down by the parent <see cref="GraphPane"/> object using the
        /// <see cref="PaneBase.CalcScaleFactor"/> method, and is used to proportionally adjust
        /// font sizes, etc. according to the actual size of the graph.
        /// </param>
        /// <seealso cref="PickScale"/>
        /// <seealso cref="AxisType.Ordinal"/>
        override public void PickScale(GraphPane pane, Graphics g, float scaleFactor)
        {
            // call the base class first
            base.PickScale(pane, g, scaleFactor);
            // First, get the date ranges from the first curve in the list
            double xMin; // = Double.MaxValue;
            double xMax; // = Double.MinValue;
            double yMin; // = Double.MaxValue;
            double yMax; // = Double.MinValue;
            double tMin = 0;
            double tMax = 1;
            foreach (CurveItem curve in pane.CurveList)
            {
                if ((_ownerAxis is Y2Axis && curve.IsY2Axis) ||
                        (_ownerAxis is YAxis && !curve.IsY2Axis) ||
                        (_ownerAxis is X2Axis && curve.IsX2Axis) ||
                        (_ownerAxis is XAxis && !curve.IsX2Axis))
                {
                    curve.GetRange(out xMin, out xMax, out yMin, out yMax, false, false, pane);
                    if (_ownerAxis is XAxis || _ownerAxis is X2Axis)
                    {
                        tMin = xMin;
                        tMax = xMax;
                    }
                    else
                    {
                        tMin = yMin;
                        tMax = yMax;
                    }
                }
            }
            double range = Math.Abs(tMax - tMin);
            // Now, set the axis range based on a ordinal scale
            base.PickScale(pane, g, scaleFactor);
            OrdinalScale.PickScale(pane, g, scaleFactor, this);
            SetScaleMag(tMin, tMax, range / Default.TargetXSteps);
        }
        /**//// <summary>
        /// Make a value label for an <see cref="AxisType.Weekly" /> <see cref="Axis" />.
        /// </summary>
        /// <param name="pane">
        /// A reference to the <see cref="GraphPane"/> object that is the parent or
        /// owner of this object.
        /// </param>
        /// <param name="index">
        /// The zero-based, ordinal index of the label to be generated.  For example, a value of 2 would
        /// cause the third value label on the axis to be generated.
        /// </param>
        /// <param name="dVal">
        /// The numeric value associated with the label.  This value is ignored for log (<see cref="Scale.IsLog"/>)
        /// and text (<see cref="Scale.IsText"/>) type axes.
        /// </param>
        /// <returns>The resulting value label as a <see cref="string" /></returns>
        override internal string MakeLabel(GraphPane pane, int index, double dVal)
        {
            if (_format == null)
                _format = Scale.Default.Format;
            double scaleMult = Math.Pow((double)10.0, _mag);
            if ((dVal / scaleMult - (DateTime.Now.Year - 2007) * 52) > 0)
                return string.Format("{0:yy}年第{1}周", DateTime.Now,
                    (dVal / scaleMult - (DateTime.Now.Year - 2007) * 52).ToString(_format));
            else
                return string.Format("{0:yy}年第{1}周", DateTime.Now.AddYears(-1),
                    (dVal / scaleMult).ToString(_format));
        }
        #endregion
        Serialization#region Serialization
        /**//// <summary>
        /// Current schema value that defines the version of the serialized file
        /// </summary>
        public const int schema2 = 10;
        /**//// <summary>
        /// Constructor for deserializing objects
        /// </summary>
        /// <param name="info">A <see cref="SerializationInfo"/> instance that defines the serialized data
        /// </param>
        /// <param name="context">A <see cref="StreamingContext"/> instance that contains the serialized data
        /// </param>
        protected WeeklyScale(SerializationInfo info, StreamingContext context)
            : base(info, context)
        {
            // The schema value is just a file version parameter.  You can use it to make future versions
            // backwards compatible as new member variables are added to classes
            int sch = info.GetInt32("schema2");
        }
        /**//// <summary>
        /// Populates a <see cref="SerializationInfo"/> instance with the data needed to serialize the target object
        /// </summary>
        /// <param name="info">A <see cref="SerializationInfo"/> instance that defines the serialized data</param>
        /// <param name="context">A <see cref="StreamingContext"/> instance that contains the serialized data</param>
        [SecurityPermissionAttribute(SecurityAction.Demand, SerializationFormatter = true)]
        public override void GetObjectData(SerializationInfo info, StreamingContext context)
        {
            base.GetObjectData(info, context);
            info.AddValue("schema2", schema2);
        }
        #endregion
    }
}
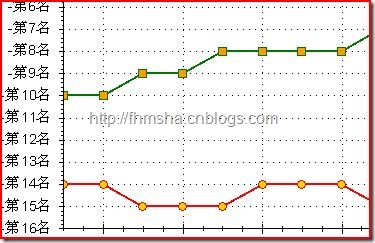
4,在web代碼中只加一句:
myPane.XAxis.Type = AxisType.Weekly;
就可以了:
PS:在官方網站上其實有另外一個方法,就是重寫XAixs的ScaleFormatEvent 方法:自定義刻度的格式
文中指出,在使用中加入如下代碼:
z1.GraphPane.XAxis.ScaleFormatEvent += new Axis.ScaleFormatHandler( XScaleFormatEvent );
就可以重寫刻度顯示:
public string XScaleFormatEvent( GraphPane pane, Axis axis, double val, int index )

{

return (val+50).ToString();

}
但是我無論如何也找不到z1.GraphPane.XAxis後面的ScaleFormatEvent 事件,也許我使用的版本已經不支持這樣的寫法了?
希望本文能對您有所幫助