下面代碼中是ECharts用AJAX從數據庫中調數據,但前端頁面無法顯示數據,求問代碼中哪裡有誤?
map1.html

 <!DOCTYPE html PUBLIC "-//W3C//DTD XHTML 1.0 Transitional//EN" "http://www.w3.org/TR/xhtml1/DTD/xhtml1-transitional.dtd">
<html xmlns="http://www.w3.org/1999/xhtml">
<head>
<meta http-equiv="Content-Type" content="text/html; charset=utf-8" />
<title>無標題文檔</title>
</head>

<body>
<div id="myChart" style="height:500px;"></div>
<script src="./js/jquery-1.8.3.min.js"></script>
<script>
$.ajax({
    type: "post",
    async: false, //同步執行
    url: "mapdata.php",
    dataType: "json", //返回數據形式為json
    success: function (result) {
            myChart.hideLoading(); //隱藏加載動畫
            myChart.setOption({ //渲染數據
                series: [{
                    // 根據名字對應到相應的系列
                    name: '2015年GDP',
                    data: result
                }]
            });
        },
        error: function () {
            alert("請求數據失敗!");
        }
});
</script>
<script src="./js/echarts.js"></script>
<script>
require.config({
    paths: {
        echarts: './js'
    }
});
require(
    [
        'echarts',
        'echarts/chart/map'   // 按需加載所需圖表,如需動態類型切換功能,別忘了同時加載相應圖表
    ],
    function (ec) {
        var myChart = ec.init(document.getElementById('myChart'));
        var option = {
            title: {
                text: '2015年GDP統計數據',
                subtext: '數據來源網絡(單位:億元)',
                left: 'center' //標題居中
            },
            tooltip: { //提示工具,
                trigger: 'item',
                formatter: "{a} <br/>{b} : {c}億元"
            },
            visualMap: { //視覺映射組件,可以根據范圍調節數據變化
                min: 0, //最小值
                max: 10, //最大值
                left: 'left', //位置
                top: 'bottom',
                orient: 'horizontal', //水平
                text: ['高', '低'], // 文本,默認為數值文本
                calculable: true //是否啟用值域漫游,即是否有拖拽用的手柄,以及用手柄調整選中范圍。
            },
            toolbox: { //工具欄
                show: true,
                orient: 'vertical', //垂直
                left: 'right',
                top: 'center',
                feature: {
                    mark: {
                        show: true
                    },
                    saveAsImage: {
                        show: true
                    } //保存為圖片
                }
            },
            series: [{
                name: '2015年GDP',
                type: 'map',
                mapType: 'china', //使用中國地圖
                roam: false, //是否開啟鼠標縮放和平移
                itemStyle: {
                    normal: {
                        label: {
                            show: true
                        }
                    },
                    emphasis: {
                        label: {
                            show: true
                        }
                    }
                },
                data: []
            }]
        };
        //myChart.showLoading(); //預加載動畫
        myChart.setOption(option); //渲染地圖
    }
);
</script>
</body>
</html>


mapdata.php


<?php
include_once('connect.php'); //連接數據庫
//查詢數據
$sql = "select * from echarts_map";
$query = mysql_query($sql);
while ($row = mysql_fetch_array($query)) {
    $arr[] = array(
        'name' => $row['province'],
        'value' => $row['gdp']
    );
}
mysql_close($q);
echo json_encode($arr); //輸出json格式數據
?>


connect.php


<?php
$q = mysql_connect("localhost","root","dglgxx");
if(!$q)
{
die('Could not connect: ' . mysql_error());
}
mysql_query("set names utf8"); //以utf8讀取數據
mysql_select_db("test02",$q); //數據庫
?>
數據庫的表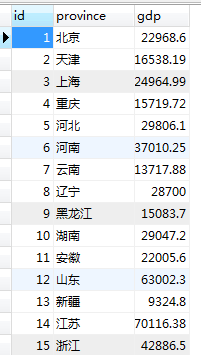
先打印一下result,看你的後台把json值傳過來沒有,