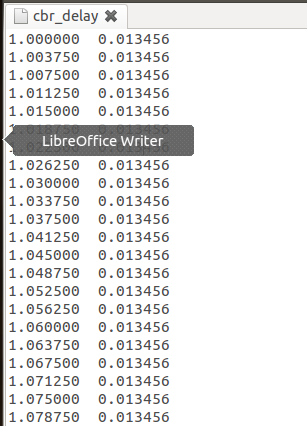
如何去掉圖表上的網格,左邊Y軸的數字。還有如何設置數字的起始位置,比如一個天氣應用當天的溫度是28至35攝氏度,然後數字的起始位置設置為25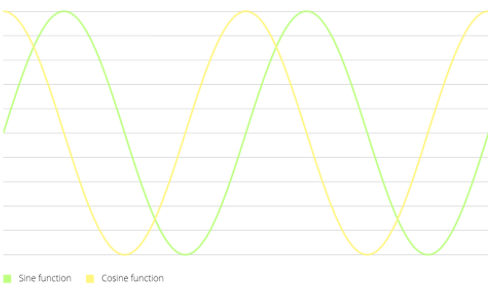
跟這樣的差不多
哈哈已經搞定;給大家看看
//是否啟用網格背景
mChart.setDrawGridBackground(false);
//是否設置Y軸坐標
mChart.setDrawYLabels(false);
//設置網格豎線是否顯示
mChart.setDrawVerticalGrid(false);
// 設置在Y軸上是否是從0開始顯示
mChart.setStartAtZero(false);
//是否在Y軸顯示數據,就是曲線上的數據
mChart.setDrawYValues(true);
//設置網格
mChart.setDrawBorder(false);
mChart.setBorderPositions(new BarLineChartBase.BorderPosition[]{
BarLineChartBase.BorderPosition.BOTTOM});
//在chart上的右下角加描述
//mChart.setDescription("曲線圖");
//設置Y軸上的單位
mChart.setUnit("");
//設置透明度
mChart.setAlpha(0.8f);
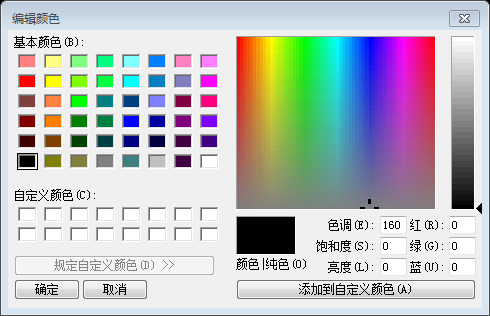
//設置網格底下的那條線的顏色
mChart.setBorderColor(Color.rgb(213, 216, 214));
//設置Y軸前後倒置
mChart.setInvertYAxisEnabled(false);
//設置高亮顯示
mChart.setHighlightEnabled(true);
//設置是否可以觸摸,如為false,則不能拖動,縮放等
mChart.setTouchEnabled(true);
//設置是否可以拖拽,縮放
mChart.setDragEnabled(true);
mChart.setScaleEnabled(true);
//設置是否能擴大擴小
mChart.setPinchZoom(true);
// 設置背景顏色
mChart.setBackgroundResource(R.mipmap.mpandroidchart_bc);
//設置點擊chart圖對應的數據彈出標注
//MyMarkerView mv = new MyMarkerView(this, R.layout.custom_marker_view);
// define an offset to change the original position of the marker
// (optional)
//定義一個偏移量來改變標記的原始位置
//mv.setOffsets(-mv.getMeasuredWidth() / 2, -mv.getMeasuredHeight());
// set the marker to the chart
//設置標記圖
//mChart.setMarkerView(mv);
// enable/disable highlight indicators (the lines that indicate the
// highlighted Entry)
//啟用/禁用突出指標(表明行突出顯示的條目)
mChart.setHighlightIndicatorEnabled(false);
XLabels xl = mChart.getXLabels();
// xl.setAvoidFirstLastClipping(true);
// xl.setAdjustXLabels(true);
xl.setPosition(XLabels.XLabelPosition.BOTTOM); // 設置X軸的數據在底部顯示
xl.setTextSize(10f); // 設置字體大小
xl.setSpaceBetweenLabels(3); // 設置數據之間的間距
    YLabels yl = mChart.getYLabels();
    // yl.setPosition(YLabelPosition.LEFT_INSIDE); // set the position
    yl.setTextSize(10f); // s設置字體大小
    yl.setLabelCount(5); // 設置Y軸最多顯示的數據個數
    // 加載數據
    setData();

    //從X軸進入的動畫
    mChart.animateX(2000);
    mChart.animateY(2000);   //從Y軸進入的動畫
    mChart.animateXY(2000, 2000);    //從XY軸一起進入的動畫

    //設置最小的縮放
    mChart.setScaleMinima(0.5f, 1f);
    //設置視口
    // mChart.centerViewPort(10, 50);

    // get the legend (only possible after setting data)
    //後得到圖例(唯一可能設置數據)
    Legend l = mChart.getLegend();
    l.setForm(Legend.LegendForm.LINE);  //設置圖最下面顯示的類型
    l.setTextSize(15);
    l.setTextColor(Color.rgb(104, 241, 175));
    l.setFormSize(30f); // set the size of the legend forms/shapes 圖例形式/形狀的大小

    // 刷新圖表
    mChart.invalidate();

            set1.setDrawCubic(true);  //設置曲線為圓滑的線
    set1.setCubicIntensity(0.2f);
    set1.setDrawFilled(false);  //設置包括的范圍區域填充顏色
    set1.setDrawCircles(true);  //設置有圓點
    set1.setLineWidth(2f);    //設置線的寬度
    set1.setCircleSize(5f);   //設置小圓的大小
    set1.setHighLightColor(Color.rgb(244, 117, 117));
    set1.setColor(Color.rgb(104, 241, 175));    //設置曲線的顏色
    // create a data object with the datasets
    LineData data = new LineData(xVals, set1);