I searched the Internet before and couldn't find a good way to save it. Here is an introduction:
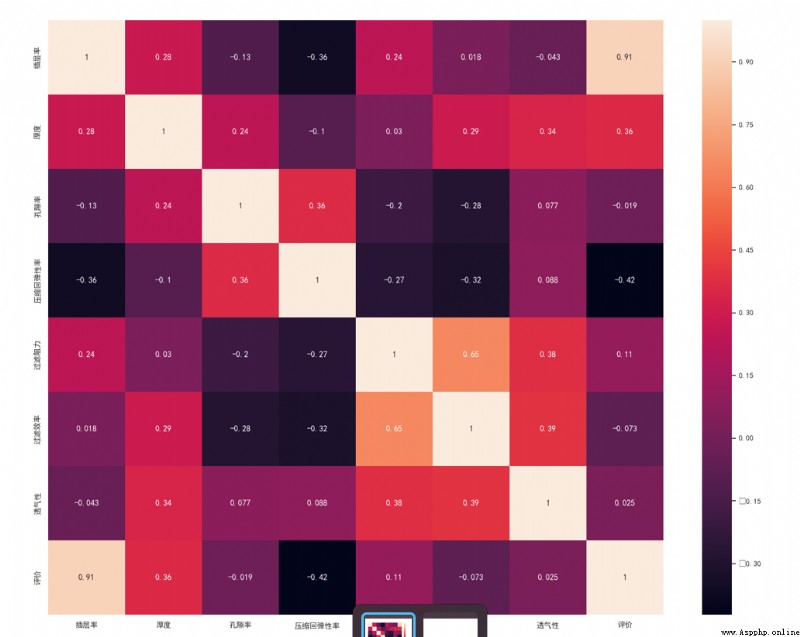
# seaborn Chinese garbled solutionfrom matplotlib.font_manager import FontPropertiesmyfont=FontProperties(fname=r'C:\Windows\Fonts\simhei.ttf',size=20)sns.set(font=myfont.get_name()span>, color_codes=True)chazhi66_corr = chazhi66.corr(method="spearman")#Calculate the correlation coefficientplt.figure(figsize=(20,15))#figsize can specify the size of the heatmapfig=sns.heatmap(chazhi66_corr,annot=True,fmt='.2g')#annot display data on the heat map; fmt='.2g' reserve two significant figures for the datafigfig.get_figure().savefig('chazhi66_corr.png')#Keep picturesKey words for saving images:
fig.get_figure().savefig('chazhi66_corr.png')#reserve picturesGenerated image: