@[1] 讀取.npz格式數據
@[2] 繪圖方式1:使用的是先創建畫布=plt.figure(),在畫布上添加子圖=fig.add_subplot(),然後在子圖上繪圖
繪圖方式2:創建畫布plt.figure();添加子圖plt.subplot(2, 2, 2),再plt上繪圖
import numpy as np
import matplotlib.pyplot as plt
from scipy import interpolate
if __name__ == '__main__':
# 創建數組
x = [[1, 2, 20, 3], [7, 8, 10, 9]]
a = np.asarray(x)
for i in np.nditer(a):
print(i, '\r')
# 保存成.npz格式
print("保存成.npz格式")
np.savez('text.npz', date=a)
# 加載.npz
print("加載.npz")
b = np.load('text.npz')['date']
print(b)
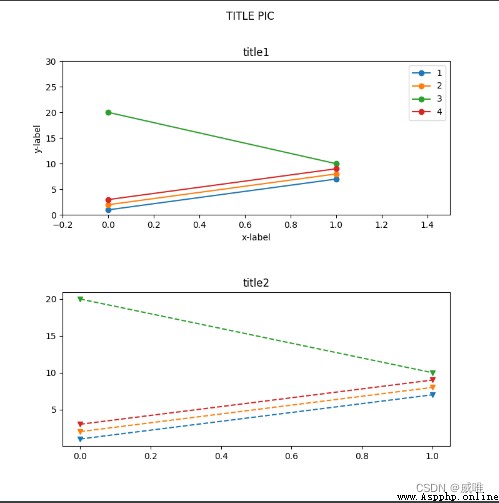
#一 繪圖
fig = plt.figure(num=1, figsize=(8, 8)) # 創建畫布,可避免直接用subplot的重疊
fig.suptitle("TITLE PIC")
fig.subplots_adjust(wspace=0.2, hspace=0.5) # 圖間距
ax1 = fig.add_subplot(311)
ax1.plot(b, '-o') # c是二維4列數組,數據是 每列上的點 連線;只有y值
ax1.legend([1, 2, 3, 4, 5]) #線圖例
ax1.set_ylim(0, 30) #設置刻度范圍
ax1.set_xlim((-0.2, 1.5))
ax1.set_xlabel('x-label') #標簽
ax1.set_ylabel('y-label')
ax1.set_title('title1') #小表頭
ax2 = fig.add_subplot(313)
ax2.plot(b, '--v')
plt.title("title2", loc="center")
ax2.set_title('title2')
# 保存
plt.savefig('title.jpg')
plt.savefig('title.png')
plt.show()
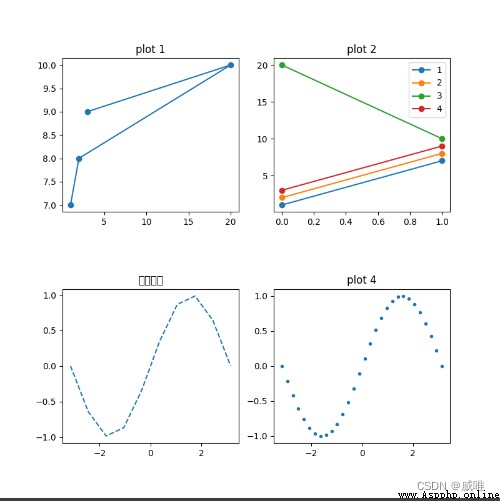
#二 多圖
fig1 = plt.figure(num=1, figsize=(8, 8))
fig1.subplots_adjust(wspace=0.2, hspace=0.5) # 圖間距
xpoint = np.array([1, 2, 20, 3])
ypoint = np.array([7, 8, 10, 9])
# plot1
plt.subplot(2, 2, 1)
plt.plot(xpoint, ypoint, '-o')
plt.title("plot 1")
# plot2
plt.subplot(2, 2, 2)
plt.plot(b, '-o')
plt.legend([1, 2, 3, 4])
plt.title("plot 2")
# plot3
x = np.linspace(-np.pi, np.pi, 10)
y = np.sin(x)
f = interpolate.interp1d(x, y, kind='cubic')
nx = np.linspace(-np.pi, np.pi, 30)
ny = f(nx)
plt.subplot(2, 2, 3)
plt.plot(x, y, '--')
plt.title("三階插值")
# plot4
plt.subplot(2, 2, 4)
plt.plot(nx, ny, '.')
plt.title("plot 4")
plt.show()