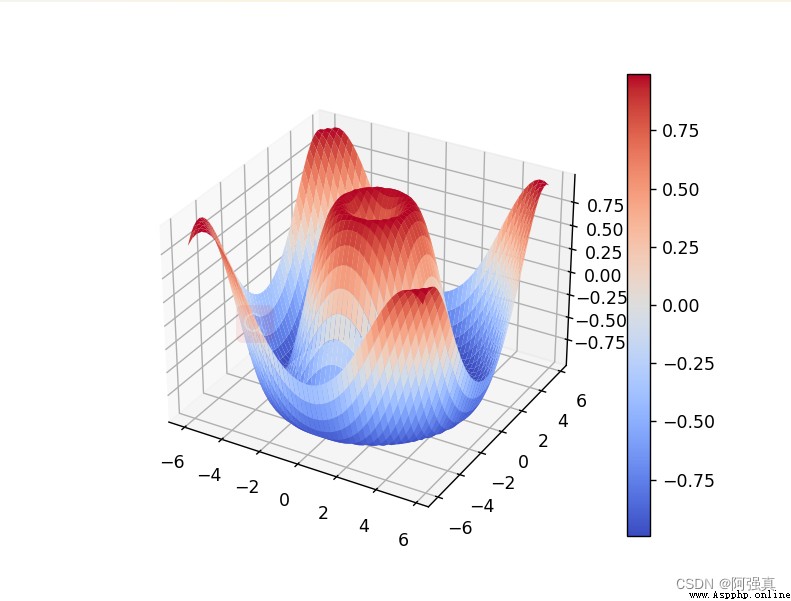
Draw a 3D surface map Z = sin ( x 2 + y 2 ) \text{Draw a 3D surface map}Z=\sin \left( \sqrt{x^2+y^2} \right) Draw a 3D surface mapZ=sin(x2+y2)
import pylab as plt
import numpy as np
ax=plt.axes(projection="3d")
X=np.arange(-6,6,0.25)
Y=np.arange(-6,6,0.25)
X,Y=np.meshgrid(X,Y)
Z=np.sin(np.sqrt(X**2+Y**2))
surf=ax.plot_surface(X,Y,Z,cmap="coolwarm")
plt.colorbar(surf)
plt.show()
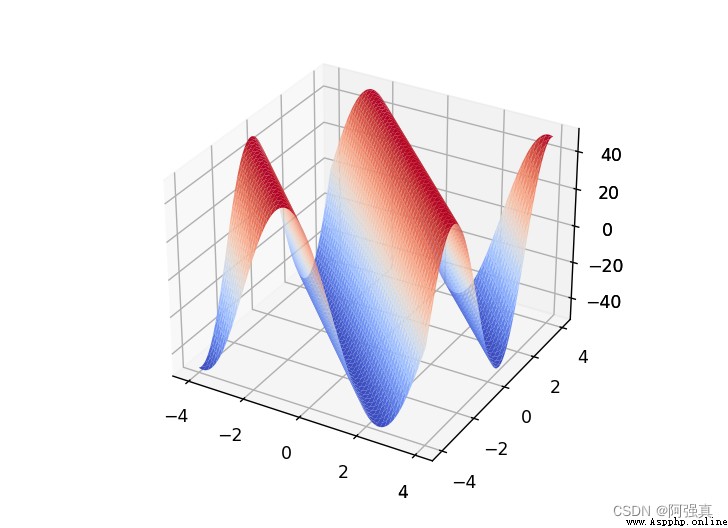
Draw a 3D surface graph Z = 50 sin ( x + y ) \text{Draw a 3D surface graph}Z=50\sin \left( x+y \right) Draw a 3D surface graphZ=50sin(x+y)
import pylab as plt
import numpy as np
x=np.linspace(-4,4,100)
x,y=np.meshgrid(x,x)
z=50*np.sin(x+y)
ax=plt.axes(projection="3d")
ax.plot_surface(x,y,z,cmap="coolwarm")
plt.show()
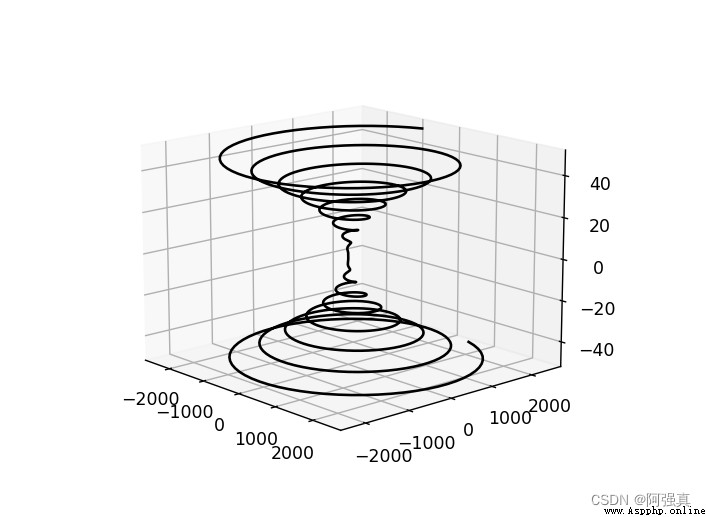
Draw a three-dimensional curve x = s 2 sin s , y = s 2 cos s , s = s , s ∈ [ − 50 , 50 ] \text{Draw a three-dimensional curve}x=s^2\sin s,y=s^2\cos s,s=s,s\in \left[ -50,50 \right] Draw a three-dimensional curvex=s2sins,y=s2coss,s=s,s∈[−50,50]
import pylab as plt
import numpy as np
s=np.linspace(-50,50,1000)
x=s**2*np.sin(s);y=s**2*np.cos(s)
ax=plt.axes(projection="3d")
ax.plot(x,y,s,"k")
plt.show()
 pycharm installs django framework detailed steps (Python 3.8.1), write your first Django application
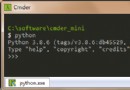
1. Check out our python versio
 Anaconda launched pyscript. How far is it to write Python in the front end?
List of articles Preface One