The content of the article is my own learningpandasSome notes made,Knowledge point collocation case,The content is comprehensive and detailed.
目錄
Series對象
●創建Series對象
●Series的索引
DataFrame對象
●創建DataFrame對象
DataFramesome important properties of objects
DataFrame對象的一些重要方法
導入外部數據
導入.xIs或.xIsx文件
導入csv文件
導入html網頁數據
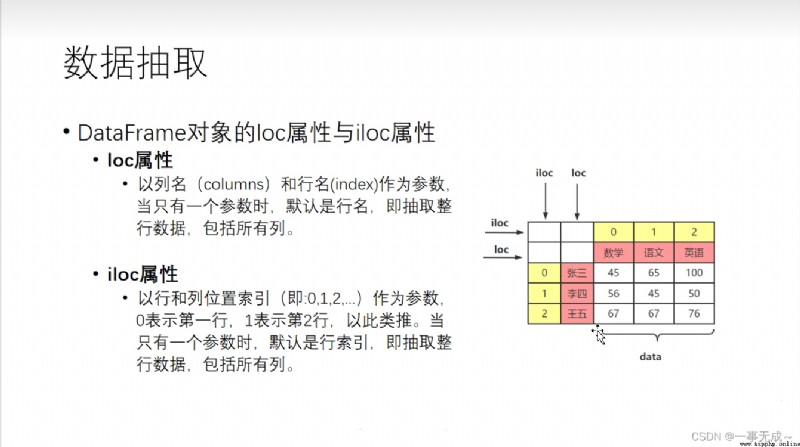
數據提取loc和iloc的使用
Data extraction is row by row
Data extraction is by column
Extract area data
Filter the specified condition data
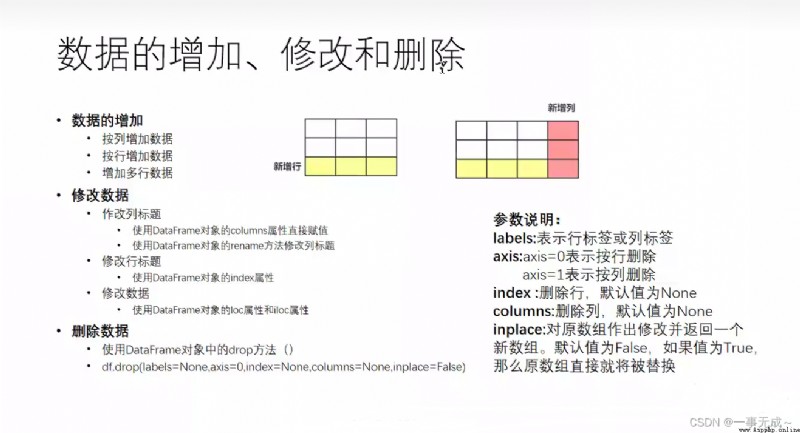
Addition, modification and deletion of data
數據增加
數據修改(Modification of content and indexing)
刪除數據drop()
數據清洗(Handling of missing and duplicate values)
View missing values and identify missing values
缺失值的處理方式
重復值處理
索引設置
Edited to reset the index
設置某列為行索引
●Reset the continuous index after data cleaning
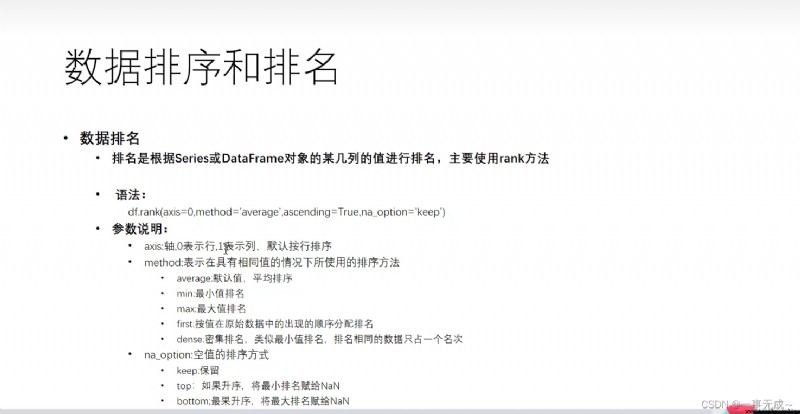
數據的排序和排名
數據的排序sort_values()方法
ranking of the data rank()
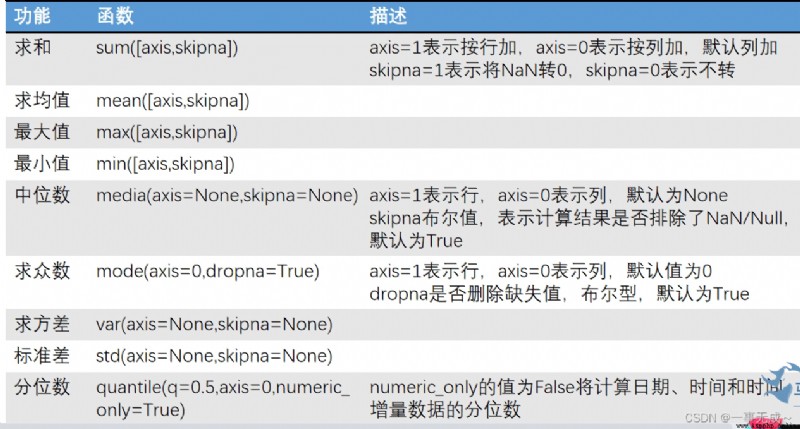
數據的計算(Summation variance, etc)
數據格式化
Edit to set the number of decimal places
設置千位分隔符
設置百分比
apply() applymap() map() 區別
Statistical analysis of data groupinggroupby()
Iteration of grouped data
對分組的某列或多列使用聚合函數
通過字典和Series對象進行分組統計
數據移位 .shift()
數據轉換
一列數據轉換為多列數據
行列轉換
DataFrame轉換為字典、列表和元組
數據合並
merge()
mergeMethods are merged one-to-one
左連接
右連接
內連接 外連接
Many-to-many or many-to-one merge
concat()
縱向合並
橫向合並
交叉合並
數據導出
導出數據為Excel文件
導出數據為CSV文件
日期數據處理
日期數據轉換
dt對象的使用
Get date range data
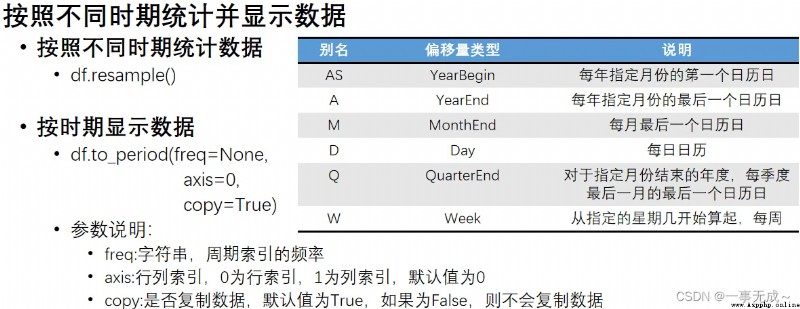
按時期統計並顯示數據
按時期統計數據 df.resample()
按時期顯示數據 df.to_period()
Statistics are displayed first
時間序列 pandas.date_range()
時間序列重采樣
時間序列數據匯總 resample().ohlc()
移動窗口數據計算 df.rolling()
●Pandas庫中的一種數據結構,類似於一維數組
●Consists of a set of data and labels associated with this set of data(索引)組成
●SeriesObjects can store integers、浮點數、字符串、PythonObjects and other data types
pd.Series(data,index=index)
import pandas as pd
data=['語文','數學','英語']
s=pd.Series(data=data,index=['張三','李四','王五'])print(s)
# 張三 語文
# 李四 數學
# 王五 英語
# dtype: object
●位置索引
●索引范圍[0,N-1]
●Label cable引
●索引名稱
●Get multiple tag index values to use[Label cable引1,Label cable...]
●切片索引
●[start:stop:step]
●獲取Series's rope bow|和值
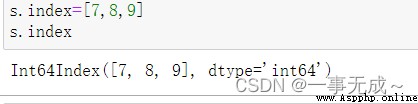
●獲取索引s.index
●獲取值s.values
這是一個Series對象s
張三 語文
李四 數學
王五 英語
dtype: object
●位置索引
print(s[1]) >>>數學
●Label cable引
print(s['李四']) >>>數學
print(s[['張三','王五']])
# 張三 語文
# 王五 英語
# dtype: object
●切片索引
#Position index slice 含頭不含尾
print(s[0:2])
# 張三 語文
# 李四 數學
# dtype: object
#Label cable引切片 含頭含尾
print(s['張三':'王五'])
# 張三 語文
# 李四 數學
# 王五 英語
# dtype: object
●Series's rope bow|和值
s.values
# ['語文' '數學' '英語']
s.index
# Index(['張三', '李四', '王五'], dtype='object')
●DataFrame對象是Pandas庫中的一種數據結構,類似於二維數組,由行列構成
●與Series一樣支持多種數據類型
●pd.DataFrame(data,index,columns,dtype)
import pandas as pd
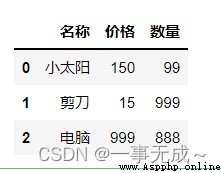
data=[['小太陽',150,99],['剪刀',15,999],['電腦',999,888]]
columns=['名稱','價格','數量']
s=pd.DataFrame(data=data,columns=columns)
s
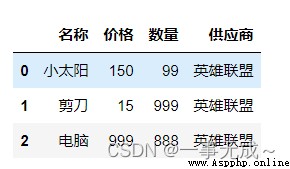
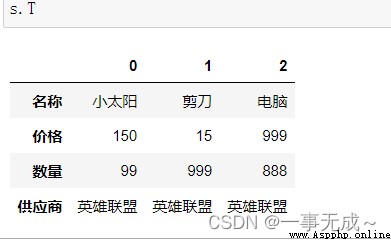
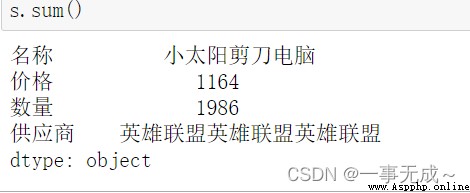
data={
'名稱':['小太陽','剪刀','電腦'],
'價格':[150,15,999],
'數量':[99,999,888],
'供應商':'英雄聯盟'
}
s=pd.DataFrame(data=data)
s
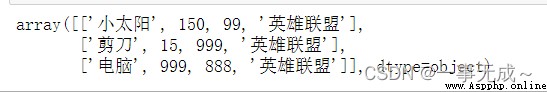
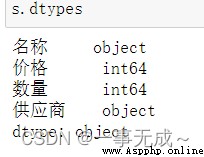
# 1 values 查看所有元素的值
# 2 dtypes 查看所有元素的類型
# 3 index 查看所有行名、重命名行名
# 4 columns 查看所有列名、重命名列名
# 5 T 行列數據轉換
# 6 head 查看前N條數據,默認5條
# 7 tail 查看後N條數據,默認5條
# 8 shape 查看行數和列數shape[0]表示行,shape[1]表示列
data={
    '名稱':['小太陽','剪刀','電腦'],
    '價格':[150,15,999],
    '數量':[99,999,888],
    '供應商':'英雄聯盟'
}
s=pd.DataFrame(data=data)
1 s.values
2 s.dtypes
3 s.index
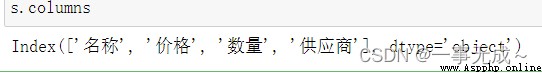
4 s.columns
5 s.T
8 s.shape s.shape[0] s.shape[1]
(3,4) 3 4
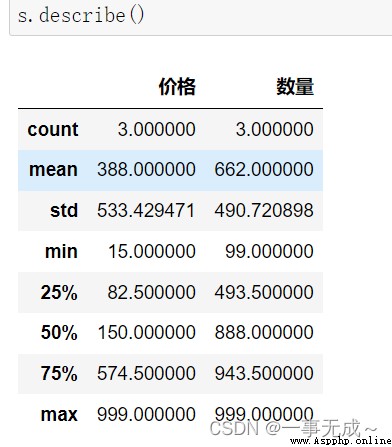
# 1 describe() 查看每列的統計匯總信息,DataFrame類型
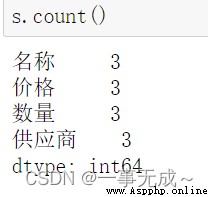
# 2 count() Returns the number of non-null values for each column
# 3 sum() 返回每一列的和,無法計算返回空值
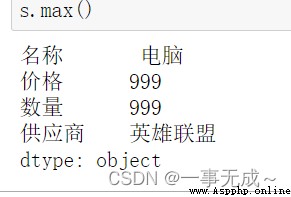
# 4 max() 返回每一列的最大值
# 5 min() 返回每一列的最小值
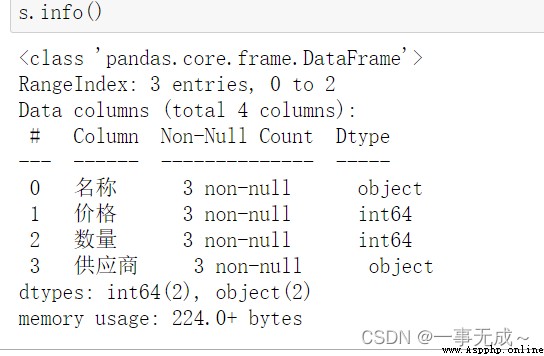
# 6 info() 查看索引、數據類型和內存信息
●導入.xIs或.xIsx文件
●pd.read _excel(io,sheet_ name,header)
●常用參數說明
●io:表示.xIs或.xIsx文件路徑或類文件對象
●sheet_name:表示工作表,用法如下
●header:默認值為0,Take the value of the first row as the column name,數據為除列名以外的數據,If the data does not contain column names,則設置header=None
sheet_ name=0 第一個Sheet頁中的數據作為DataFrame對象
sheet_ name=1 第二個Sheet頁中的數據作為DataFrame對象
sheet_ name= 'Sheet1' 名稱為'Sheet1 '的Sheet頁中的數據作為DataFrame對象
sheet name=[0,1,'Sheet3'] 第一 The second and the name areSheet3的Sheet頁中的數據作為DataFrame象
sheet_ name=None 讀取所有工作表
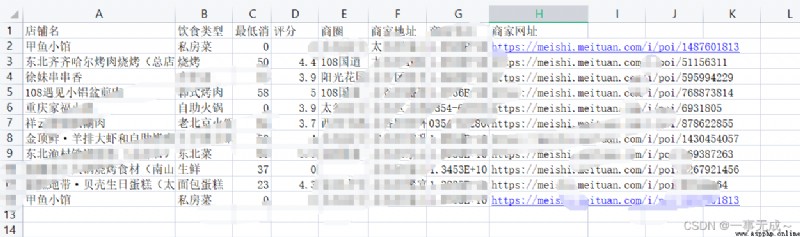
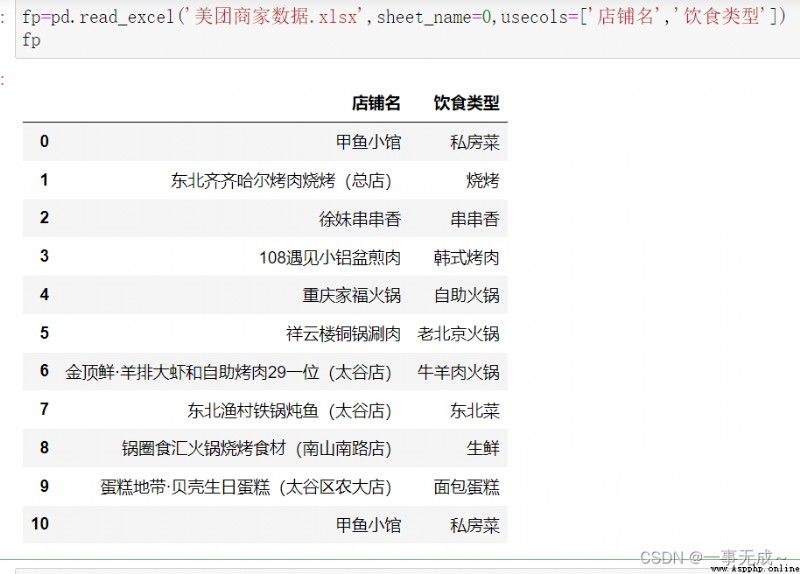
fp=pd.read_excel('Meituan merchant data.xlsx',sheet_name=0,usecols=['店鋪名','飲食類型'])
或fp=pd.read_excel('Meituan merchant data.xlsx',sheet_name=0,usecols=[0,1])
● pd.read_ _csv(filepath_ or_ buffer ,sep=',',header,encoding= None)
● 常用參數說明
● filepath_ _or_ _buffer:字符串、文件路徑,也可以是URL鏈接
● sep:字符串、分隔符
● header:指定作為列名的行,默認值為0,即Take the value of the first row as the column name.數據為除列名以外的數據,If the data does not contain a list,則設置header= None
● encoding:字符串, 默認值為None,文件的編碼格式
fp=pd.read_csv(r'C:\Users\xiaoxin15\Desktop\Food business data.csv',sep=',',encoding='gbk')
# gbk對應ANSI
print(fp.head(5))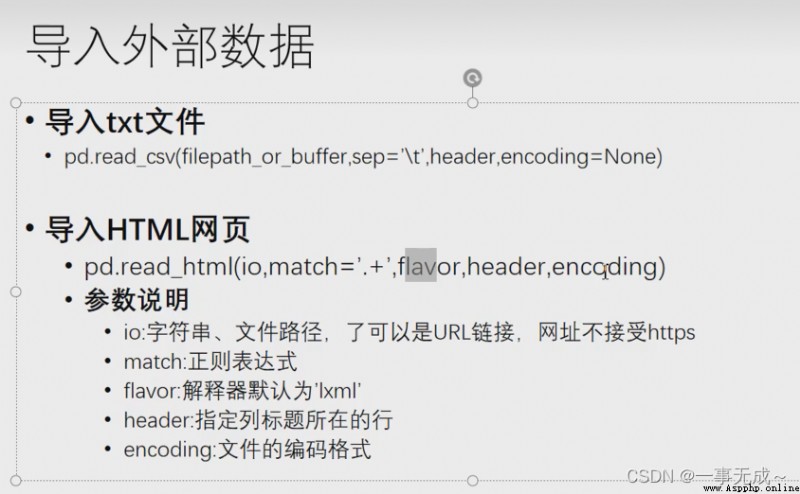
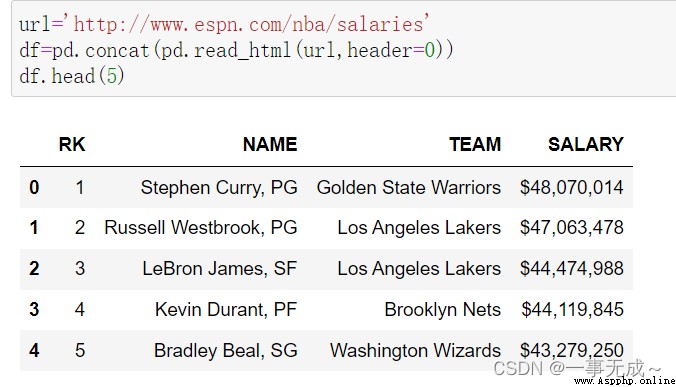
# Can only read containstableTabbed pages
import pandas as pd
url='http://www.espn.com/nba/salaries'
df=pd.concat(pd.read_html(url,header=0))
print(df)
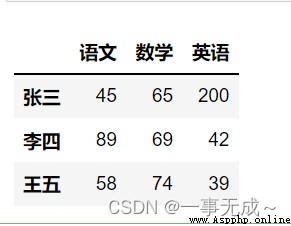
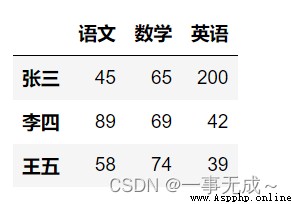
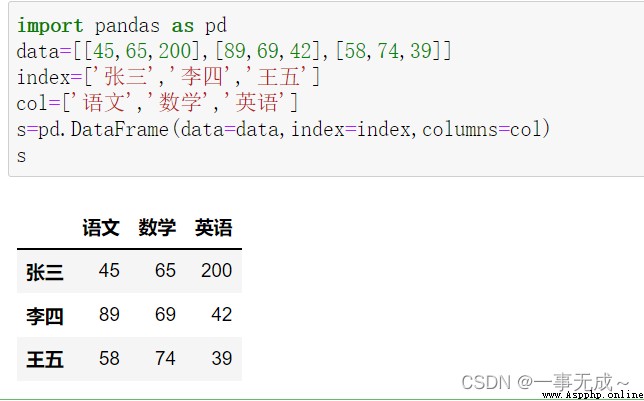
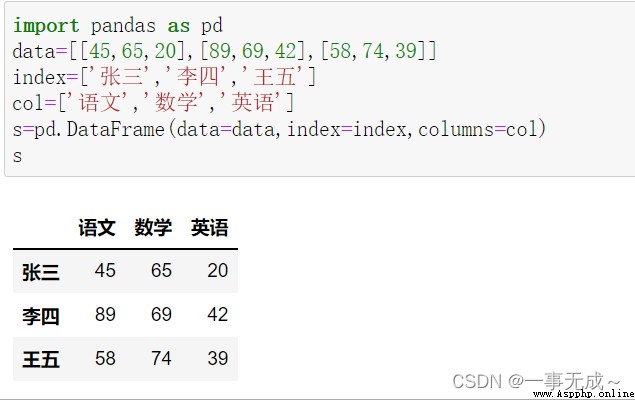
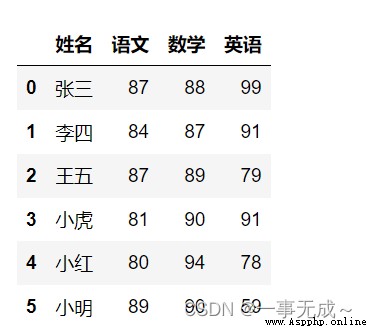
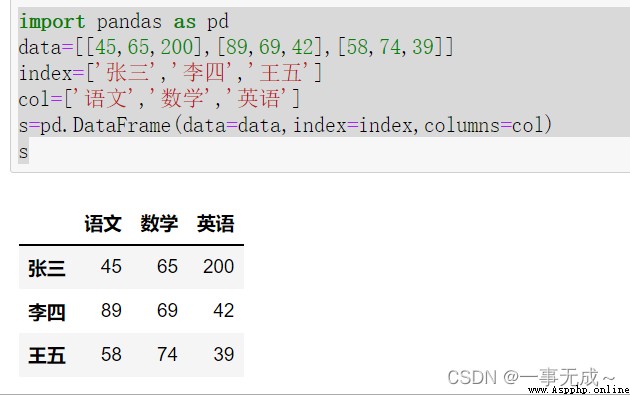
import pandas as pd
data=[[45,65,200],[89,69,42],[58,74,39]]
index=['張三','李四','王五']
col=['語文','數學','英語']
s=pd.DataFrame(data=data,index=index,columns=col)
s
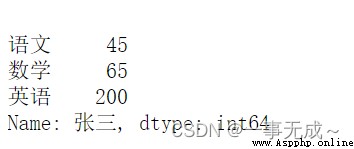
('----------------------------------------------------------------數據提取 根據標簽')
s.loc['張三']('----------------------------------------------------------------數據提取 根據序列')
s.iloc[0]
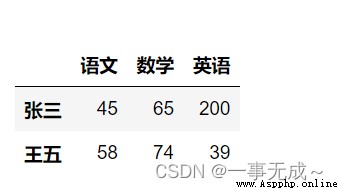
('----------------------------------------------------------------數據提取 Extract multiple lines')
s.loc[['張三','王五']]或
s.iloc[[0,2]]
('----------------------------------------------------------------切片')
s.loc['張三':'王五']
s.iloc[0:2]含頭不含尾
s.iloc[::]#start:stop:step
print('----------------------------------------------直接使用列名')
s[['數學','英語']]print('---------------------------------------------使用loc iloc') :Lines are indicated to the left of the comma The column to the right of the comma is indicated
s.loc[:,['數學','英語']]
s.iloc[:,[1,2]]
print('----------------Extract continuous data')
s.loc[:,'語文':]或
s.iloc[:,0:]
或
s.iloc[:,[0,1,2]]
s.loc['張三','語文']
s.iloc[0,0]
# 45
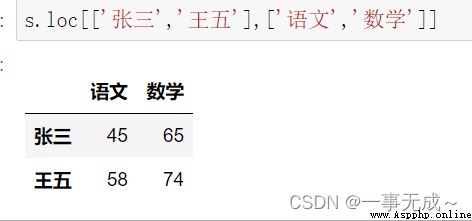
s.loc[['張三','王五'],['語文','數學']]
s.iloc[[0,2],[0,1]]
s.iloc[0:2,0:2] #,Left row slice,Right column slice
s.loc['張三':'王五','語文':'英語']
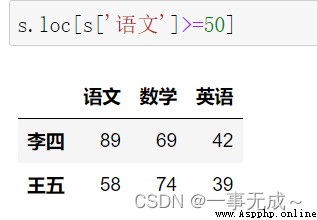
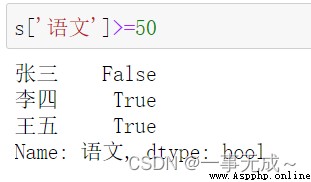
單個條件
s['語文']>=50
s.loc[s['語文']>=50]
多個條件
s.loc[(s['語文']>=50) & (s['數學']>=70)]
#按行
print('--------------------------------------直接賦值')
s['化學']=[90,88,67]
s
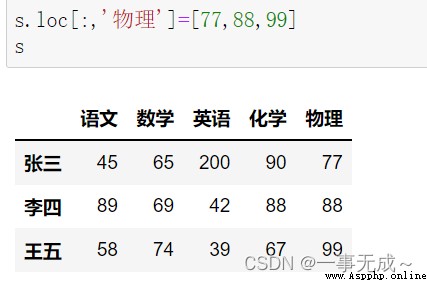
print('--------------------------------------采用locAttributes are incremented in the last column')
s.loc[:,'物理']=[77,88,99]
s
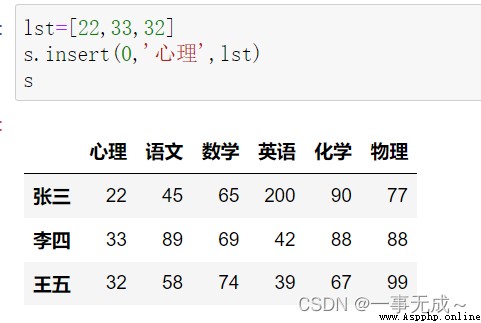
print('--------------------------------------Adds a column at the specified index position')
lst=[22,33,32]
s.insert(0,'心理',lst)
s
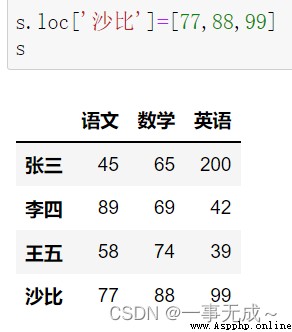
#按列
print('--------------------------------------采用loc屬性')
s.loc['沙比']=[77,88,99]
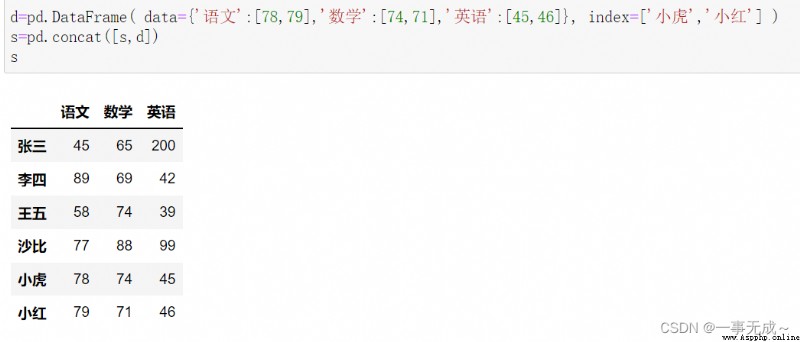
print('--------------------------------------添加多行')
d=pd.DataFrame( data={'語文':[78,79],'數學':[74,71],'英語':[45,46]}, index=['小虎','小紅'] ) s=pd.concat([s,d])
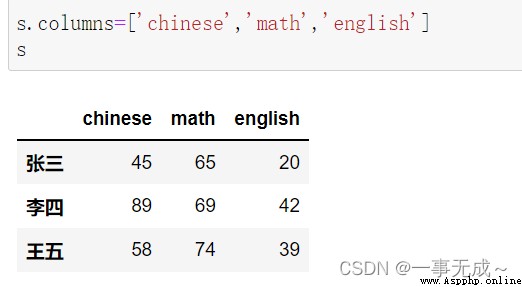
print('---------------------------------------------------------修改列索引')
print('---------------1 直接使用 columns屬性')
s.columns=['chinese','math','english']
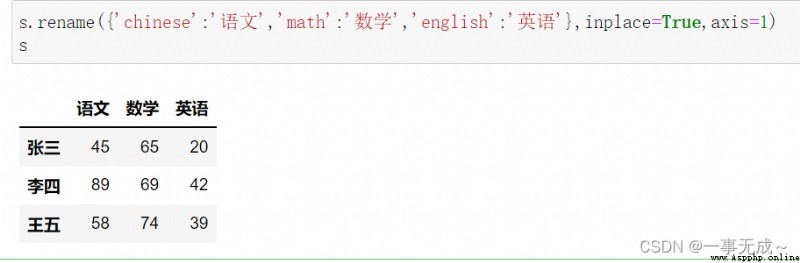
print('---------------2 使用 rename方法')
s.rename({'chinese':'語文','math':'數學','english':'英語'},inplace=True,axis=1)
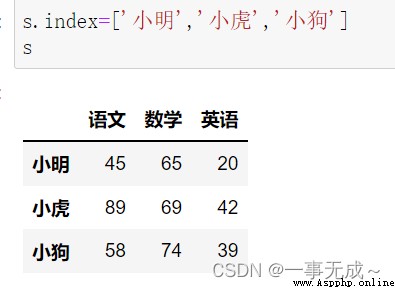
print('---------------------------------------------------------修改行索引')
print('---------------1 直接使用 index屬性')
s.index=['小明','小虎','小狗']
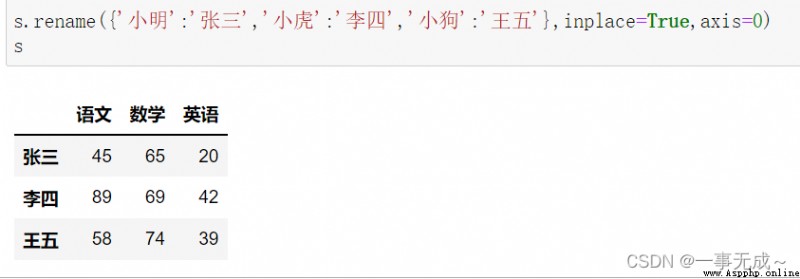
print('---------------2 使用 rename方法')
s.rename({'小明':'張三','小虎':'李四','小狗':'王五'},inplace=True,axis=0)
Modification of data content
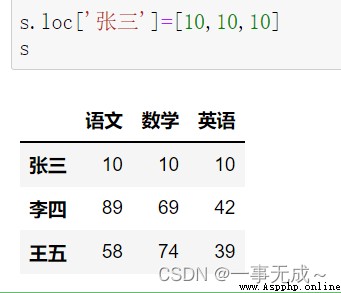
print('----------------------------------------------------------修改數據內容')
print('-------------------------修改一整行')
s.loc['張三']=[10,10,10] / s.iloc[0,:]=[10,10,10]
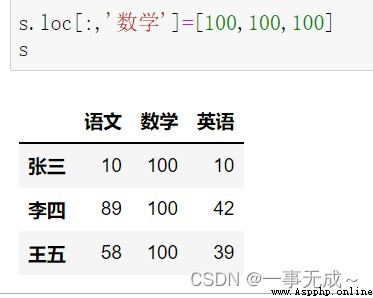
print('-------------------------修改一整列')
s['數學']=[100,100,100] s.loc[:,'數學']=[100,100,100]
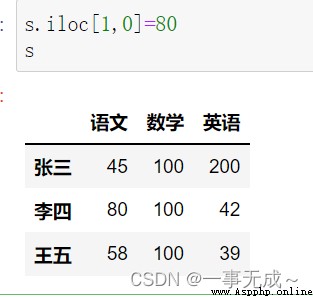
print('-------------------------Modify somewhere')
s.loc['李四','語文']=80或s.iloc[1,0]=80
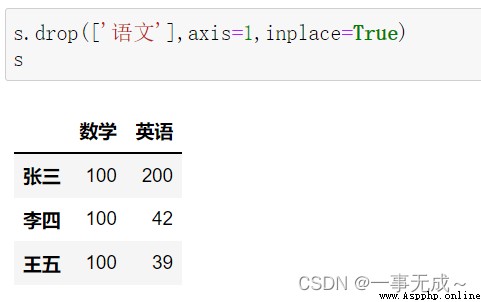
print('------------------------------------------------------------------刪除列數據')
s.drop(['語文'],axis=1,inplace=True)
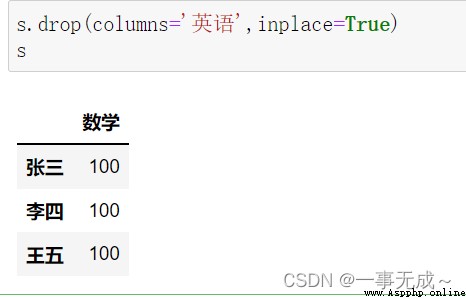
s.drop(columns='英語',inplace=True)
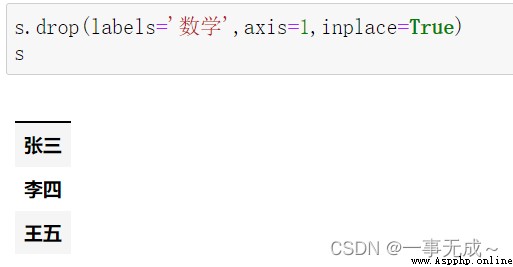
s.drop(labels='數學',axis=1,inplace=True)
print('------------------------------------------------------------刪除行數據')
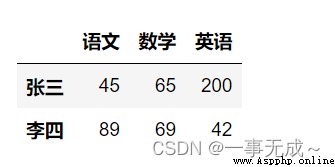
s.drop(['張三'],axis=0,inplace=True)
s.drop(index='李四',inplace=True)
s.drop(labels='王五',axis=0,inplace=True)
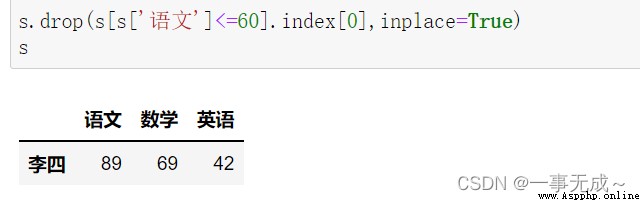
條件刪除print('------------------------------------------------------------條件刪除')
s.drop(s[s['語文']<=60].index[0],inplace=True)
#The language score is less than60的,There are Zhang San and Wang Wu,Delete row index1的王五

導入數據
import pandas as pd
pd.set_option('display.unicode.east_asian.width',True)
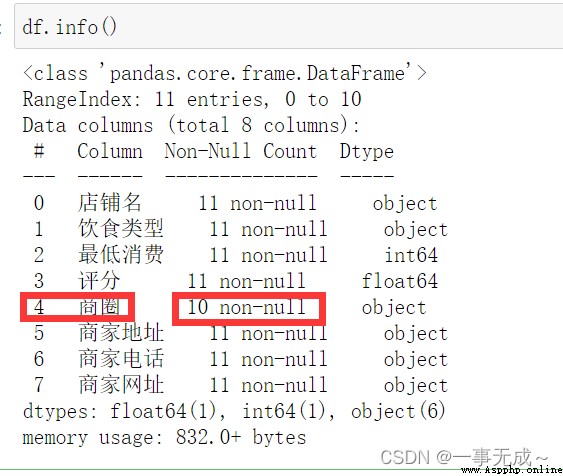
df=pd.read_excel('Meituan merchant data.xlsx')#查看是否有缺失值
df.info()
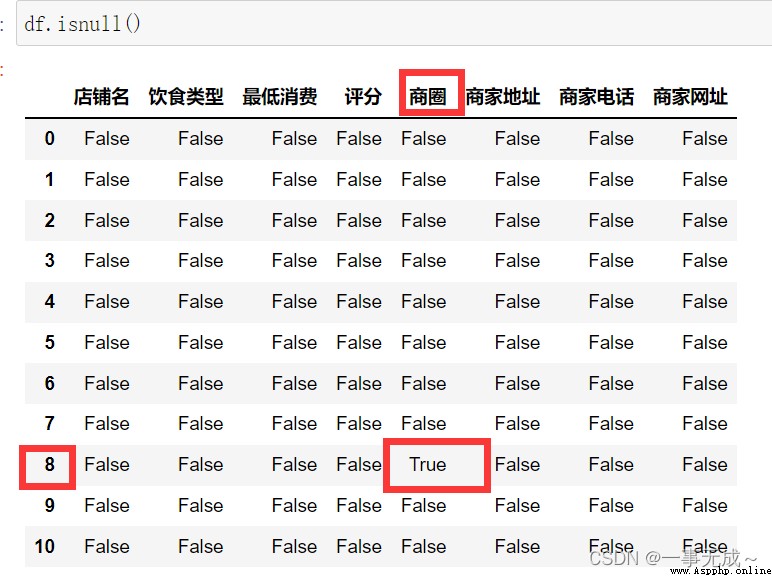
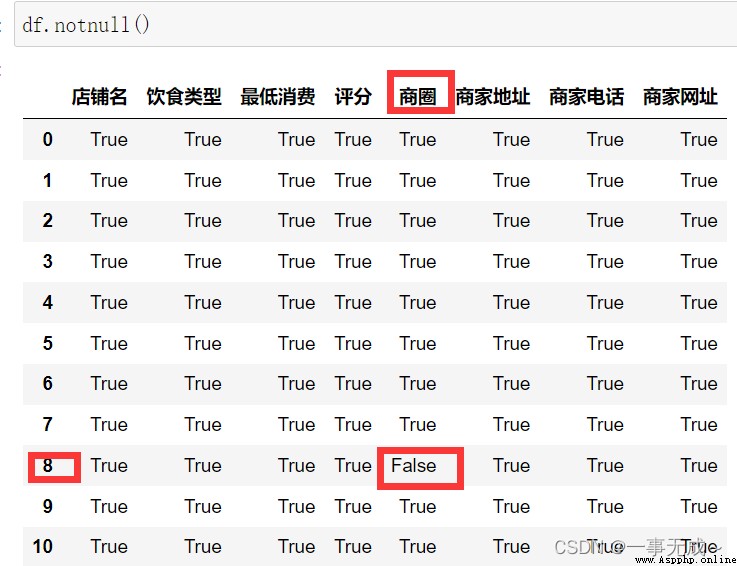
print('------------------判斷缺失值')
df.isnull()
df.notnull()
刪除
df=df.dropna() # Article 8 Data deleted
填充
df['商圈']=df['商圈'].fillna(' ')
df.iloc[8,4]
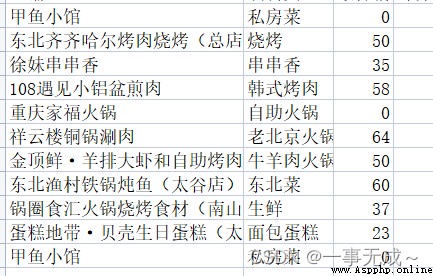
The original data section is displayed
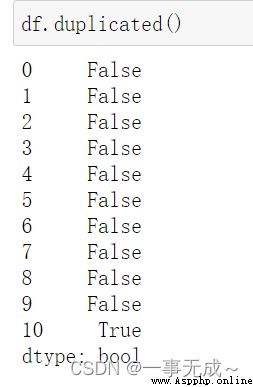
判斷是否有重復值(The first and last lines are repeated)
df.duplicated()
Remove all duplicate data
df.drop_duplicates()
#The last one was deleted
print('-------------------------Deletes all data with duplicates in the specified column')
df.drop_duplicates(['列名'])
#Suppose there are three rows of data with the same content in this column The last two rows of data will be deleted
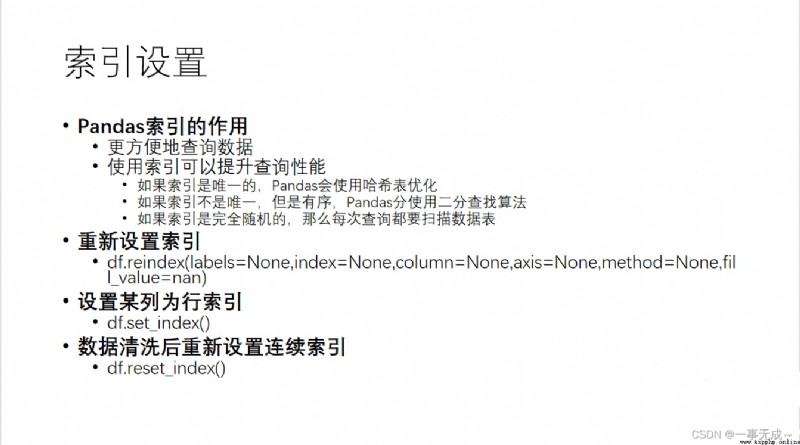
●df.reindex(labels=None,index= None,column= None,axis=None,method=None,fill_ _value=nan)
import pandas as pd
print('------------------------------------------------------------series')
s=pd.Series(data=[10,20,30],index=[1,2,3])
print(s)
print('-----------------------------重新設置索引')
print(s.reindex(range(1,6)))#The extra two arenan
print('---------------------------------------')
print(s.reindex(range(1,6),fill_value=0))#使用0填充
print('---------------------------------------')
print(s.reindex(range(1,6),method='ffill'))#向前填充
print('---------------------------------------')
print(s.reindex(range(1,6),method='bfill'))#向後填充
重點講解dataframe
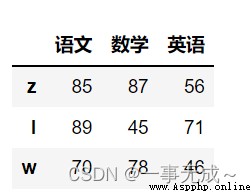
df=pd.DataFrame( data=[[85,87,56],[89,45,71],[70,78,46]], index=['z','l','w'], columns=['語文','數學','英語'] )
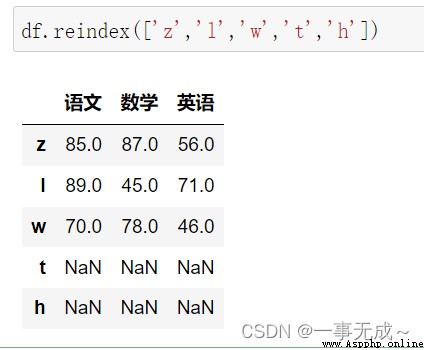
print('-----------------------------重新設置行索引')
df.reindex(['z','l','w','t','h'])
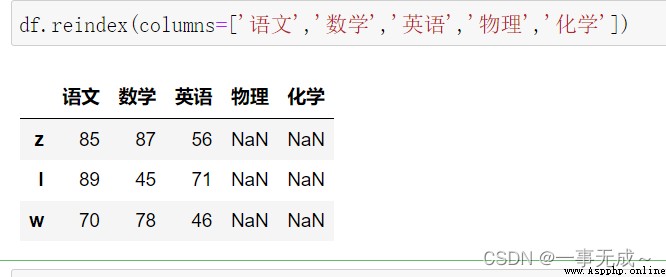
print('-----------------------------Reset the column index')
df.reindex(columns=['語文','數學','英語','物理','化學'])
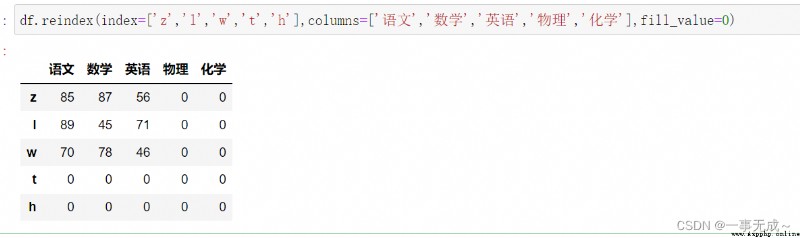
print('-----------------------------Also set the row and column index')
df.reindex(index=['z','l','w','t','h'],columns=['語文','數學','英語','物理','化學'],fill_value=0)
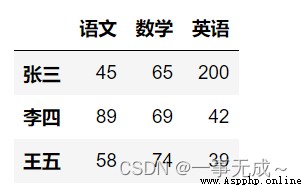
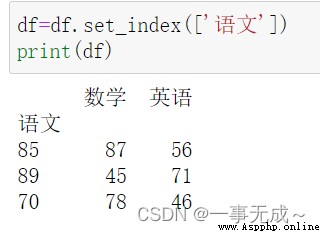
df.set_ index()
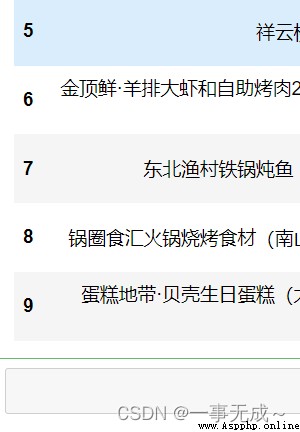
df.reset_ _index()
df.reset_index(drop=True)
#其效果就是 For example, the deduplication of the previous data will cause the index to be discontinuous,Use this method to make discontinuous indices continuous 如下圖


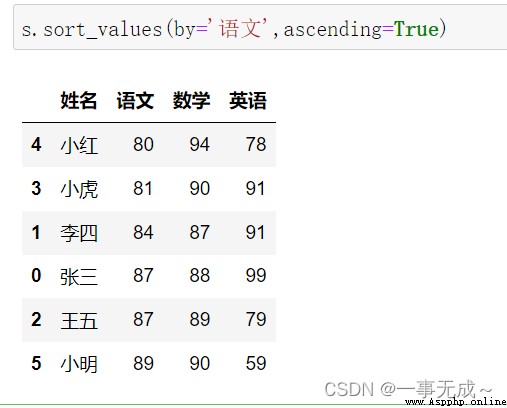
s.sort_values(by='語文',ascending=True)
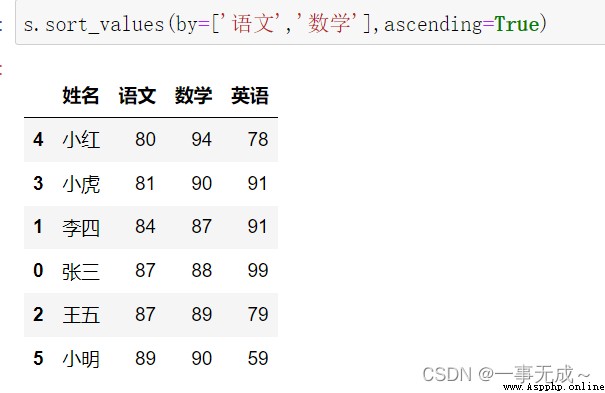
s.sort_values(by=['語文','數學'],ascending=True)
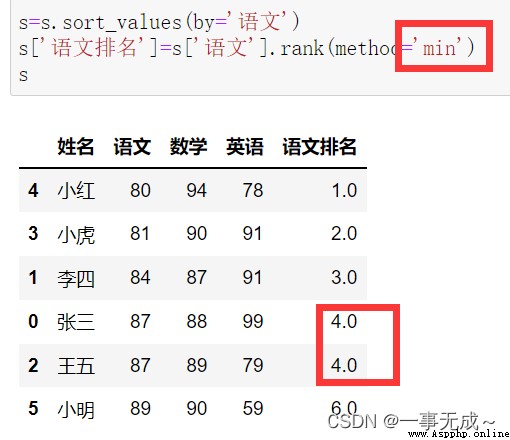
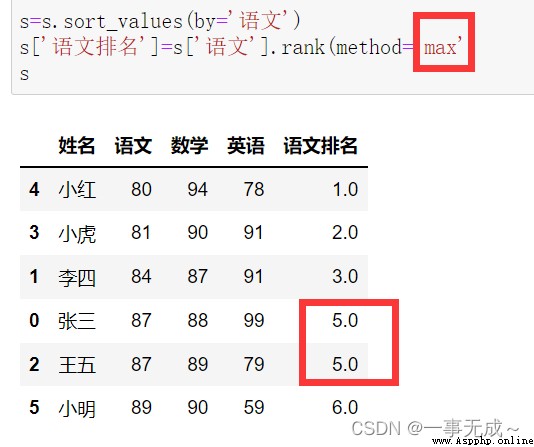
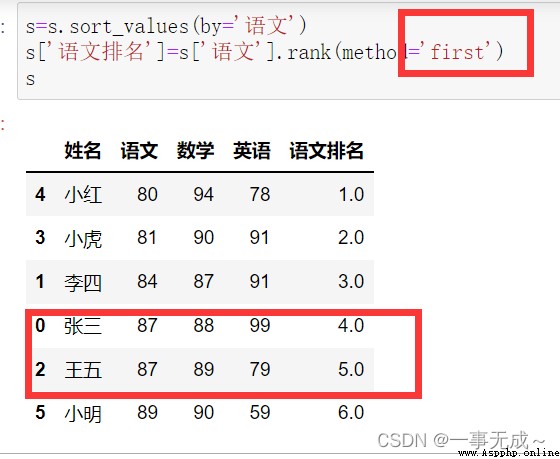
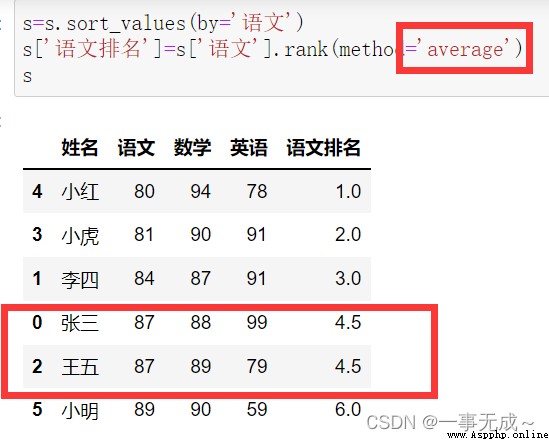
Sort first and then rank
s=s.sort_values(by='語文')
s['Language ranking']=s['語文'].rank(method='min')
s['Language ranking']=s['語文'].rank(method='max')
s['Language ranking']=s['語文'].rank(method='first')
s['Language ranking']=s['語文'].rank(method='average')
from warnings import simplefilter
simplefilter(action="ignore",category=FutureWarning)
import pandas as pd
pd.set_option('display.unicode.east_asian_width',True)
s=pd.read_excel('數據排序.xlsx')
# print(s)
# 姓名 語文 數學 英語
# 0 張三 87 88 99
# 1 李四 84 87 91
# 2 王五 87 89 79
# 3 小虎 81 90 91
# 4 小紅 80 94 78
# 5 小明 89 90 5
print('-------------------------------------------------------------求和')
s['總成績']=s.sum(axis=1)
print(s)
print('-------------------------------------------------------------求均值')
s.loc['6']=['均值']+list(s.iloc[0:6,1:].mean(axis=0))
print(s)
print('-------------------------------------------------------------最大值')
s.loc['7']=['最大值']+list(s.iloc[0:6,1:].max(axis=0))
print(s)
print('-------------------------------------------------------------最小值')
s.loc['8']=['最低分']+list(s.iloc[0:6,1:].min())
print(s)
print('-------------------------------------------------------------中位數')
s.loc['9']=['中位數']+list(s.iloc[0:6,1:].median())
print(s)
print('-------------------------------------------------------------眾數')
s.loc['10']=['眾數']+list(s.iloc[0:6,1:].mode().loc[0])
print(s)
print('-------------------------------------------------------------方差')
# var()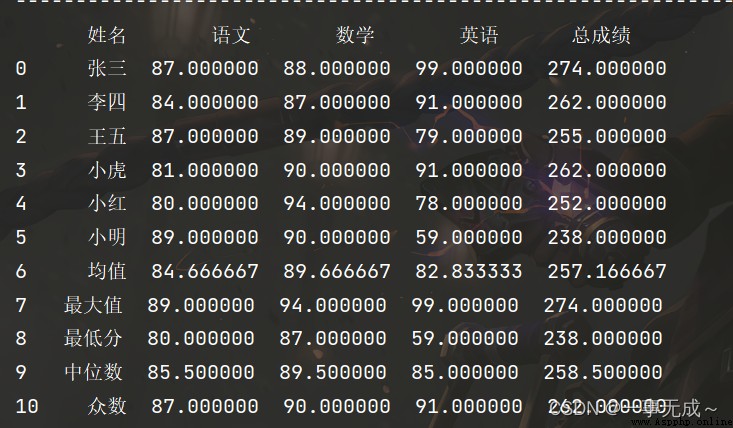
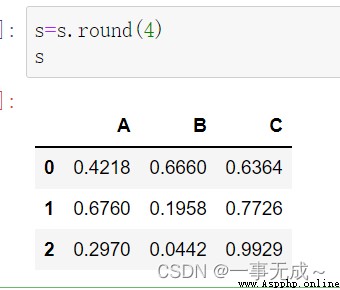
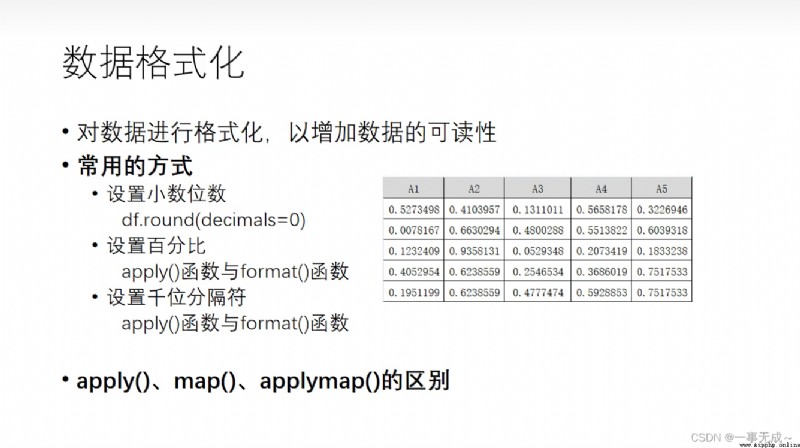 設置小數位數
s.round()
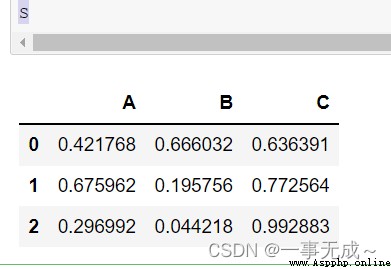
import pandas as pd
import random
s=pd.DataFrame(data=[[random.random() for i in range(0,3)],[random.random() for i in range(0,3)],[random.random() for i in range(0,3)]],columns=['A','B','C'])
s
s=s.round(4)
s
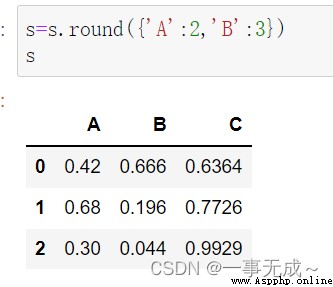
指定列
s=s.round({'A':2,'B':3})
s
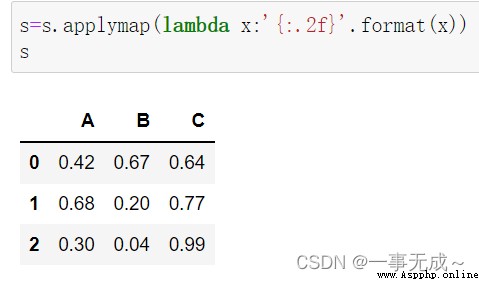
方法三 使用函數
s=s.applymap(lambda x:'{:.2f}'.format(x))
s
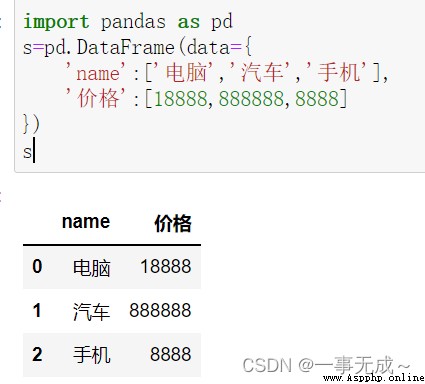
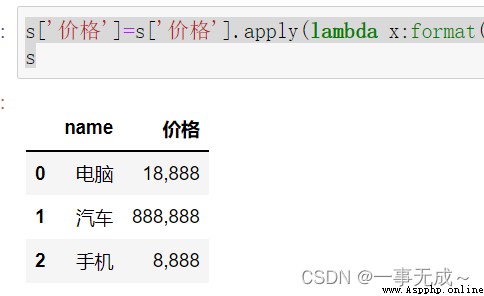
import pandas as pd
s=pd.DataFrame(data={
'name':['電腦','汽車','手機'],
'價格':[18888,888888,8888]
})
s
s['價格']=s['價格'].apply(lambda x:format(int(x),','))
s
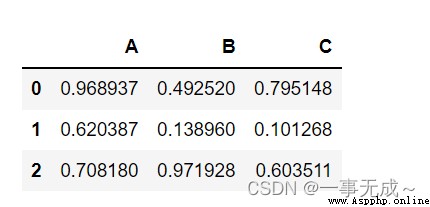
import pandas as pd
import random
s=pd.DataFrame(data=[[random.random() for i in range(0,3)],[random.random() for i in range(0,3)],[random.random() for i in range(0,3)]],columns=['A','B','C'])
s
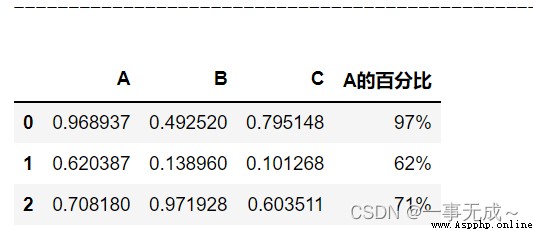
使用apply()
s['A的百分比']=s['A'].apply(lambda x:format(x,'.0%'))
s
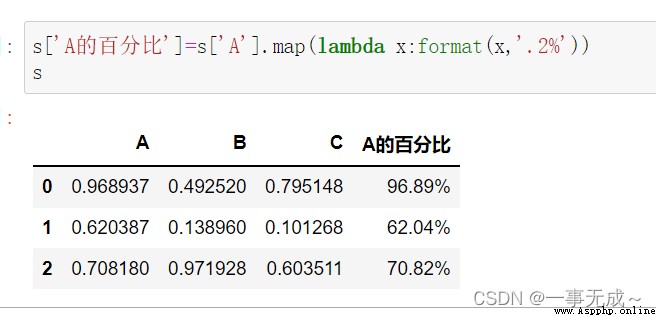
使用map()
s['A的百分比']=s['A'].map(lambda x:format(x,'.0%'))
s
1.apply()和applymap()可以用在Series,對seriesEach element executes the function once;
也可以用於dataframe,Works on each of its objects,But you can also control the effect on a column or a row,or each element;
2.map()只可以用在Series對象中.
map()Arguments can be either functions or functions字典,比如

s=s.map({'male':'男','female':'女'})

Or use a function to achieve the same effect
def aa(x):
if x=='nan':
return 'male'
else:
return 'female'
s=s.map(aa)
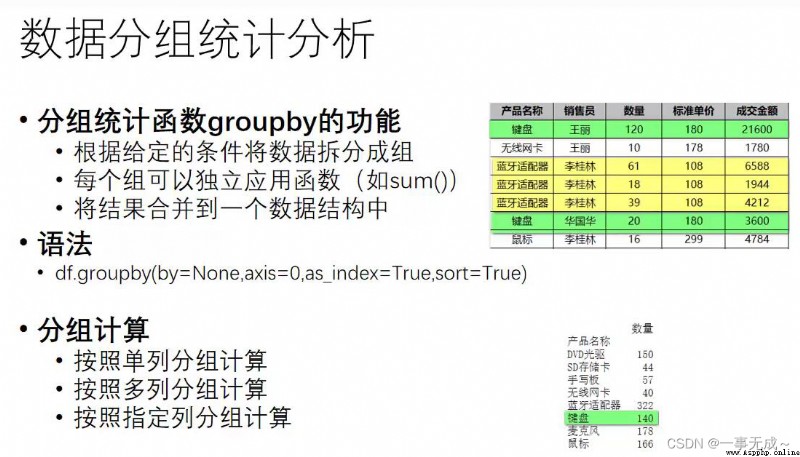
as_index=True then use the grouped label as the row index sort=True The grouped data will be sorted
as_index=False,sort=False 默認都是False
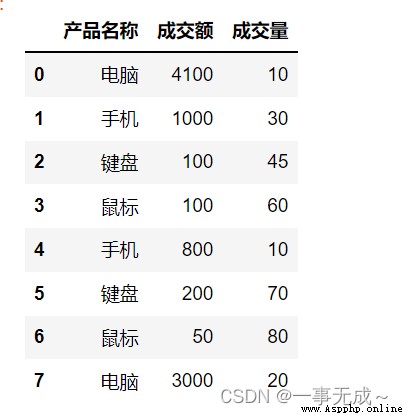
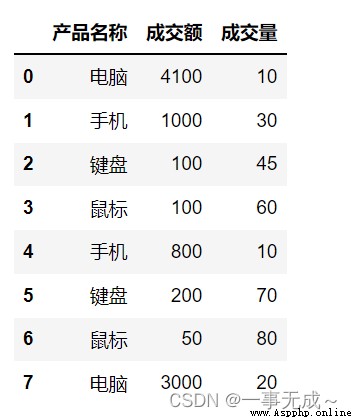
import pandas as pd
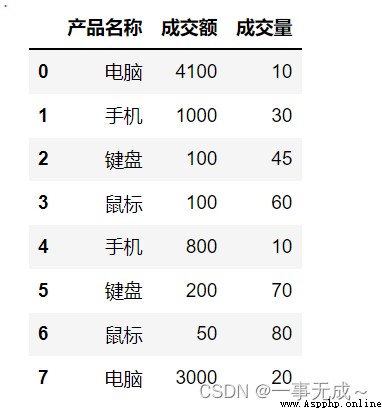
s=pd.DataFrame(data={
'產品名稱':['電腦','手機','鍵盤','鼠標','手機','鍵盤','鼠標','電腦'],
'成交額':[4100,1000,100,100,800,200,50,3000],
'成交量':[10,30,45,60,10,70,80,20]
})
s
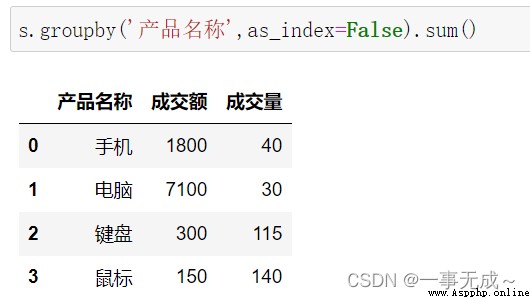
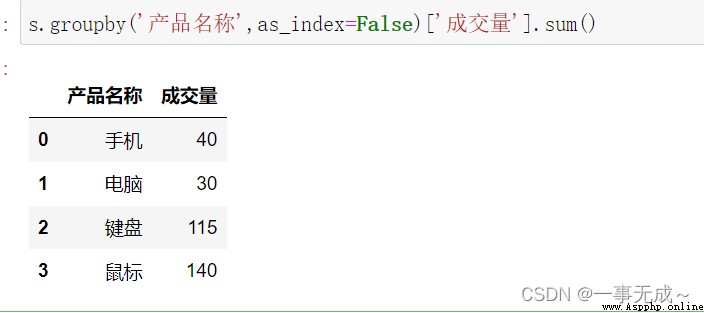
按照一列進行分組 #Summarize both volume and price
s.groupby('產品名稱',as_index=False).sum()
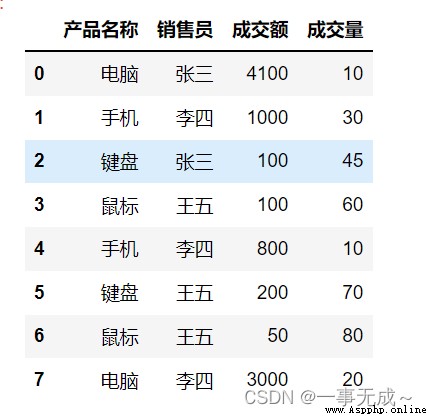
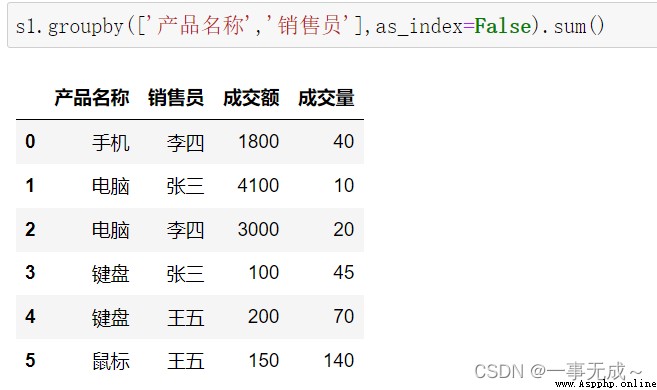
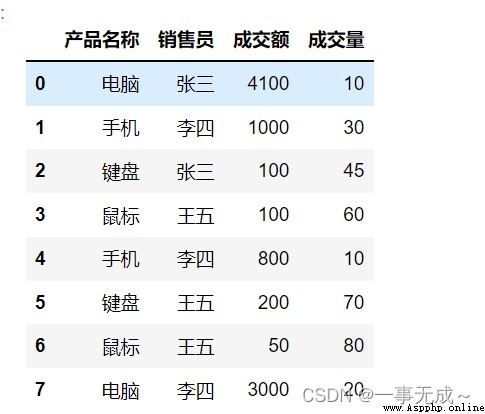
按照多列進行分組
s1=pd.DataFrame(data={
'產品名稱':['電腦','手機','鍵盤','鼠標','手機','鍵盤','鼠標','電腦'],
'銷售員':['張三','李四','張三','王五','李四','王五','王五','李四'],
'成交額':[4100,1000,100,100,800,200,50,3000],
'成交量':[10,30,45,60,10,70,80,20]
})
s1
s1.groupby(['產品名稱','銷售員'],as_index=False).sum()
Grouping performs calculations on the specified column column
s.groupby('產品名稱',as_index=False)['成交量'].sum()
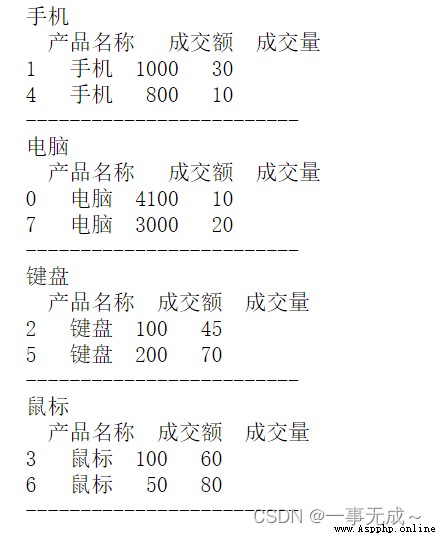
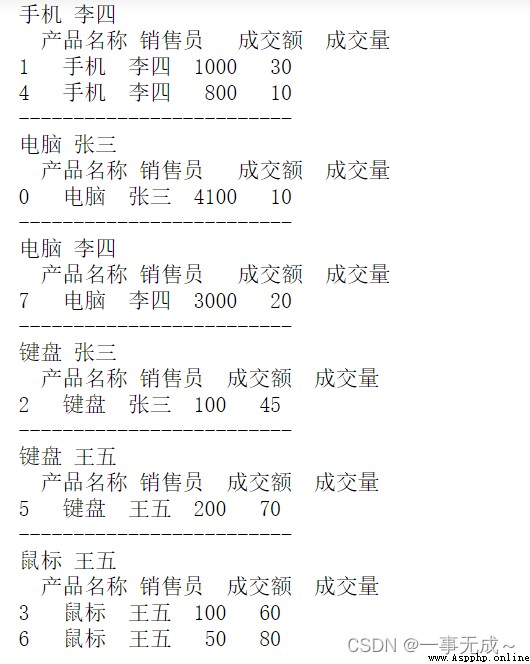
通過for循環對分組統計數據進行迭代(遍歷分組數據)
import pandas as pd
s=pd.DataFrame(data={
'產品名稱':['電腦','手機','鍵盤','鼠標','手機','鍵盤','鼠標','電腦'],
'成交額':[4100,1000,100,100,800,200,50,3000],
'成交量':[10,30,45,60,10,70,80,20]
})
s
Iteration over a single column of grouped data
s1=s.groupby('產品名稱')
for name,group in s1:
print(name)
print(group)
print('-------------------------')
Iteration over multiple columns of grouped data
s2=pd.DataFrame(data={
'產品名稱':['電腦','手機','鍵盤','鼠標','手機','鍵盤','鼠標','電腦']
'銷售員':['張三','李四','張三','王五','李四','王五','王五','李四'],
'成交額':[4100,1000,100,100,800,200,50,3000],
'成交量':[10,30,45,60,10,70,80,20] })
s3=s2.groupby(['產品名稱','銷售員'])for (n1,n2),group in s3:
print(n1,n2)
print(group)
print('-------------------------')
通過groupby()與agg()函數
Commonly used functions, sum(),mean(),max(),min()等
import pandas as pd
s=pd.DataFrame(data={
'產品名稱':['電腦','手機','鍵盤','鼠標','手機','鍵盤','鼠標','電腦','手機'],
'銷售員':['張三','李四','張三','王五','李四','王五','王五','李四','張三'],
'成交額':[4100,1000,100,100,800,200,50,3000,700],
'成交量':[10,30,45,60,10,70,80,20,15]
})
s1=s[['產品名稱','成交量']]
print(s1)
# 產品名稱 成交量
# 0 電腦 10
# 1 手機 30
# 2 鍵盤 45
# 3 鼠標 60
# 4 手機 10
# 5 鍵盤 70
# 6 鼠標 80
# 7 電腦 20
# 8 手機 15
print('----------------------------------Use aggregate functions on a single column')
a=s1.groupby('產品名稱').agg(['sum','mean'])
print(a)
# 成交量
# sum mean
# 產品名稱
# 手機 55 18.333333
# 電腦 30 15.000000
# 鍵盤 115 57.500000
# 鼠標 140 70.000000
print('----------------------------------對不同列使用不同聚合函數')
s2=s[['產品名稱','成交量','成交額']]
print(s2)
# 產品名稱 成交量 成交額
# 0 電腦 10 4100
# 1 手機 30 1000
# 2 鍵盤 45 100
# 3 鼠標 60 100
# 4 手機 10 800
# 5 鍵盤 70 200
# 6 鼠標 80 50
# 7 電腦 20 3000
# 8 手機 15 700
a=s2.groupby('產品名稱').agg({'成交量':['sum','max'],'成交額':['sum','max','mean']})
print(a)
# 成交量 成交額
# sum max sum max mean
# 產品名稱
# 手機 55 30 2500 1000 833.333333
# 電腦 30 20 7100 4100 3550.000000
# 鍵盤 115 70 300 200 150.000000
# 鼠標 140 80 150 100 75.0000001.通過字典進行分組統計
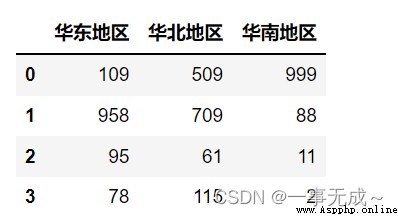
2.通過Series進行分組統計需求 Group the following data
1.通過字典進行分組統計
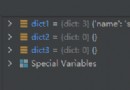
dict1={
'Sales in Beijing':'華北地區',
'上海銷量':'華東地區',
'Guangzhou sales':'華南地區',
'Tianjin sales':'華北地區',
'Suzhou sales':'華東地區',
'Shenyang sales':'華北地區'
}
s1=s.groupby(dict1,axis=1).sum()
s1
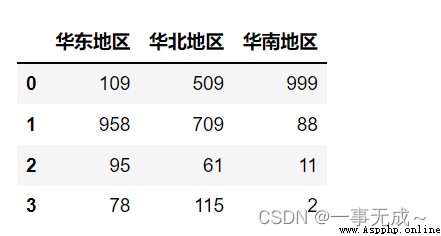
2.通過Series進行分組統計
p=pd.Series(data=['華北地區','華東地區','華南地區','華北地區','華東地區','華北地區'],index=['Sales in Beijing','上海銷量','Guangzhou sales','Tianjin sales','Suzhou sales','Shenyang sales'])
s1=s.groupby(p,axis=1).sum()
s1
作用:For example, the difference in sales between months can be calculated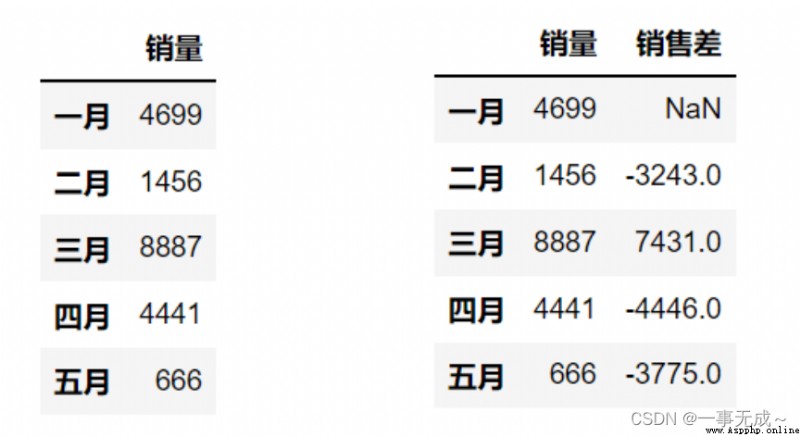
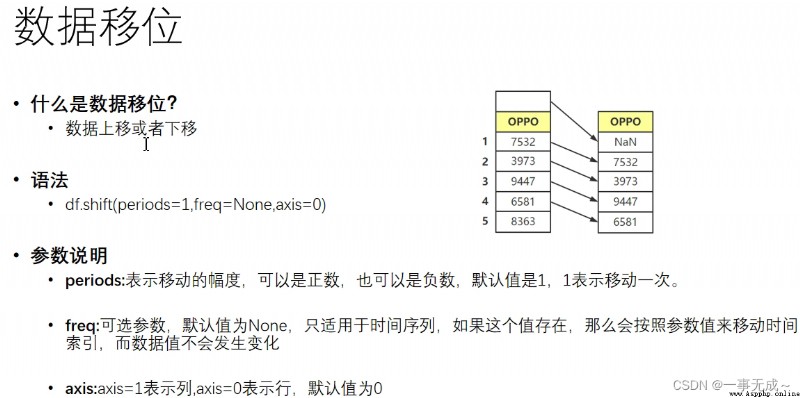
import pandas as pd
pd.set_option('display.unicode.east_asian_width', True)
s=pd.DataFrame(data={
'銷量':[4699,1456,8887,4441,666]
},index=['一月','二月','三月','四月','五月'])
print(s)
s['銷售差']=s['銷量']-s['銷量'].shift()
print(s)
Classification of data transformations
一列數據轉換為多列數據
行列轉換
DataFrame轉換為字典、Lists and tuples and more
語法
Series.str.split(pat=None,n=-1,expand=False)
參數說明:
pat : String symbols or regular expressions,Data representing string splits,默認以空格分割
n:整型、分割次數,默認值是-1.0或-1will return all split strings
expand:布爾型,分割後的結果是否轉換為DataFrame,默認值是False
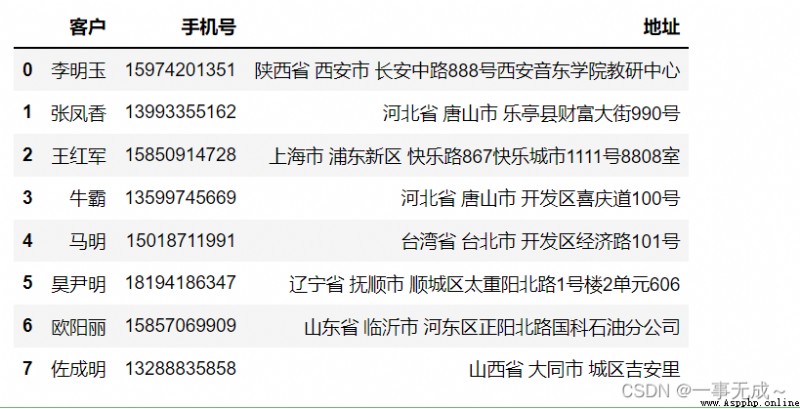
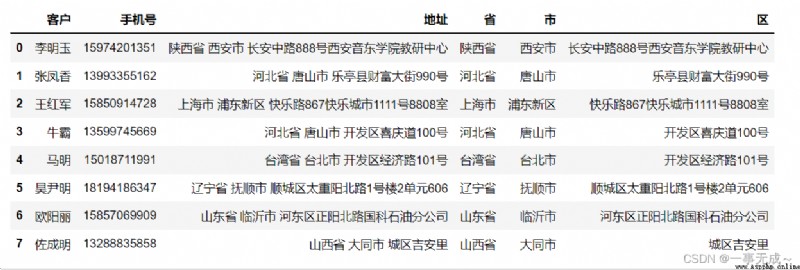
案列一 (Divide a list of addresses into provinces and cities )#Information is fabricated
import pandas as pd
pd.set_option('display.width',1000)
pd.set_option('display.max_columns',500)
s=pd.DataFrame(data=[['李明玉','15974201351','陝西省 西安市 長安中路888No. Xi'an Yindong College Teaching and Research Center'],
['Zhang Fengxiang','13993355162','河北省 唐山市 Fortune Street, Leting County990號'],
['Wang Hongjun','15850914728','上海市 浦東新區 happy road867Happy city1111號8808室'],
['Niuba','13599745669','河北省 唐山市 Happy Road in the Development Zone100號'],
['馬明','15018711991','台灣省 台北市 Development Zone Economic Road101號'],
['Hao Yinming','18194186347','遼寧省 撫順市 Taichongyang North Road, Shuncheng District1號樓2單元606'],
['歐陽麗','15857069909','山東省 臨沂市 Guoke Petroleum Branch, Zhengyang North Road, Hedong District'],
['Zuo Chengming','13288835858','山西省 大同市 Ji'anli in the city']],columns=['客戶','手機號','地址'])
s
new_s=s['地址'].str.split(' ',expand=True)
s['省']=new_s[0]
s['市']=new_s[1]
s['區']=new_s[2]
s
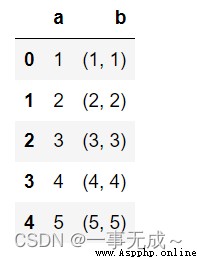
案例二:Tuple data is split
df=pd.DataFrame(data={
'a':[1,2,3,4,5],
'b':[(1,1),(2,2),(3,3),(4,4),(5,5)]
})
df
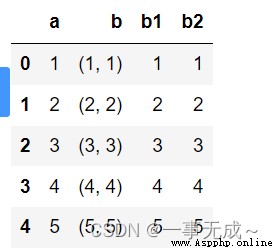
df[['b1','b2']]=df['b'].apply(pd.Series)
df
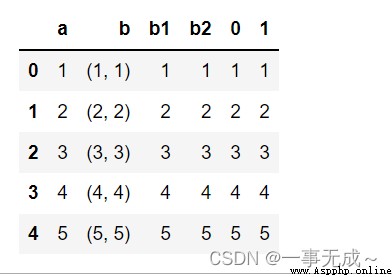
df=df.join(df['b'].apply(pd.Series))
df

案例代碼:
import pandas as pd
pd.set_option('display.unicode.east_asian_width', True)
s=pd.DataFrame(data=[
['1','1班','王*亮','84','11'],
['2','1班','楊**','82','17'],
['3','1班','王*彬','78','37'],
['4','2班','賽*琪','77','51'],
['5','2班','劉**','76','64'],
['6','2班','劉*彤','74','89']
],columns=['序號','班級','姓名','得分','排名'])
print(s)
# 序號 班級 姓名 得分 排名
# 0 1 1班 王*亮 84 11
# 1 2 1班 楊** 82 17
# 2 3 1班 王*彬 78 37
# 3 4 2班 賽*琪 77 51
# 4 5 2班 劉** 76 64
# 5 6 2班 劉*彤 74 89
s=s.set_index(['班級','序號'])
print(s)
# 姓名 得分 排名
# 班級 序號
# 1班 1 王*亮 84 11
# 2 楊** 82 17
# 3 王*彬 78 37
# 2班 4 賽*琪 77 51
# 5 劉** 76 64
# 6 劉*彤 74 89
print('-----------------------------------------Convert the original column index to the innermost row index')
s=s.stack()
print(s)
# 班級 序號
# 1班 1 姓名 王*亮
# 得分 84
# 排名 11
# 2 姓名 楊**
# 得分 82
# 排名 17
# 3 姓名 王*彬
# 得分 78
# 排名 37
# 2班 4 姓名 賽*琪
# 得分 77
# 排名 51
# 5 姓名 劉**
# 得分 76
# 排名 64
# 6 姓名 劉*彤
# 得分 74
# 排名 89
# dtype: object
print('------------------------------------------------Convert the innermost row index to a column index')
s=s.unstack()
print(s)
# ------------------------------------------------------Convert the innermost row index to a column index
# 姓名 得分 排名
# 班級 序號
# 1班 1 王*亮 84 11
# 2 楊** 82 17
# 3 王*彬 78 37
# 2班 4 賽*琪 77 51
# 5 劉** 76 64
# 6 劉*彤 74 89
print('-------------------------------------------------------------行列轉換pivot')
s=pd.DataFrame(data=[
['1','1班','王*亮','84','11'],
['2','1班','楊**','82','17'],
['3','1班','王*彬','78','37'],
['4','2班','賽*琪','77','51'],
['5','2班','劉**','76','64'],
['6','2班','劉*彤','74','89']
],columns=['序號','班級','姓名','得分','排名'])
print(s)
# # 序號 班級 姓名 得分 排名
# 0 1 1班 王*亮 84 11
# 1 2 1班 楊** 82 17
# 2 3 1班 王*彬 78 37
# 3 4 2班 賽*琪 77 51
# 4 5 2班 劉** 76 64
# 5 6 2班 劉*彤 74 89
print(s.pivot(index='序號',columns='班級',values='得分'))
# 班級 1班 2班
# 序號
# 1 84 NaN
# 2 82 NaN
# 3 78 NaN
# 4 NaN 77
# 5 NaN 76
# 6 NaN 74示例:
import pandas as pd
s=pd.DataFrame(data={
'產品名稱':['電腦','手機','鍵盤','鼠標','手機','鍵盤','鼠標','電腦'],
'成交額':[4100,1000,100,100,800,200,50,3000],
'成交量':[10,30,45,60,10,70,80,20]
})
s
轉字典:
mydict=s.to_dict()
for i in mydict:
print(i,':',mydict[i])
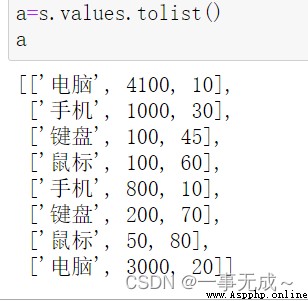
轉列表:
a=s.values.tolist()
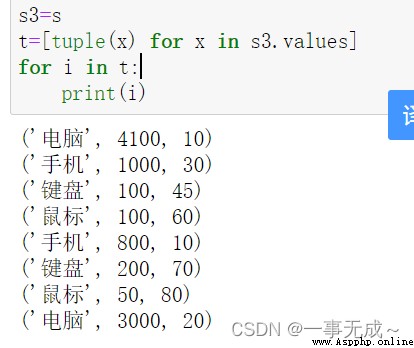
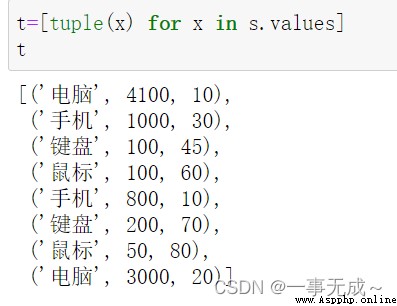
轉元組
t=[tuple(x) for x in s.values]
for i in t:
print(i)
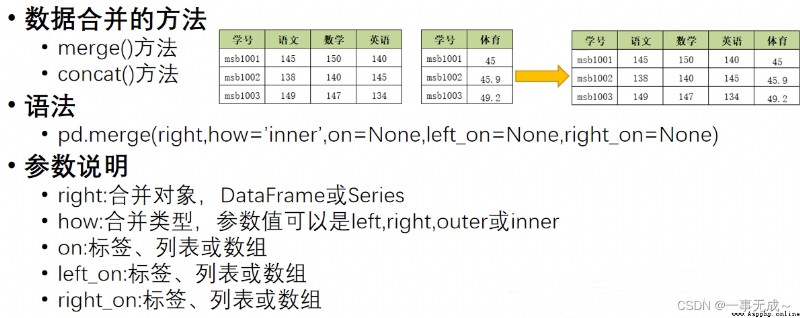
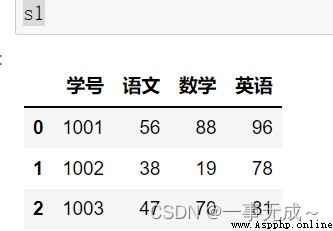
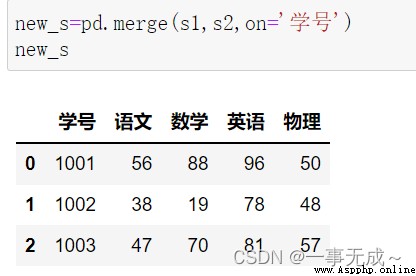
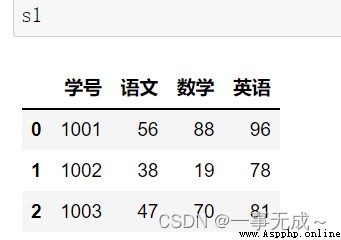
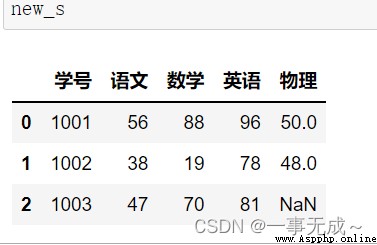
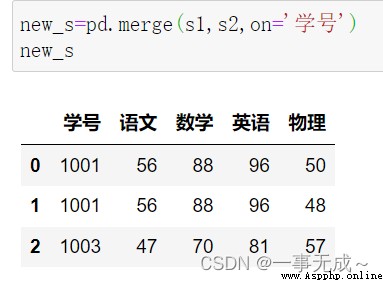
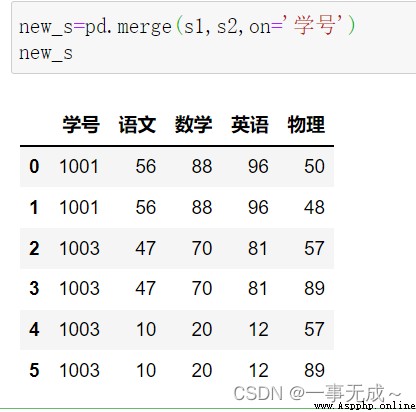
mergeMethods are merged one-to-one
import pandas as pd
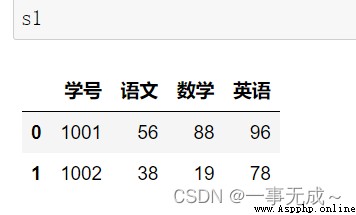
s1=pd.DataFrame(data={ '學號':[1001,1002,1003], '語文':[56,38,47], '數學':[88,19,70], '英語':[96,78,81] })
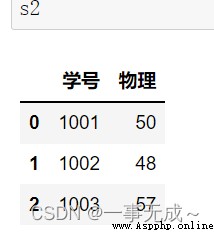
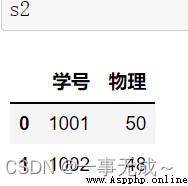
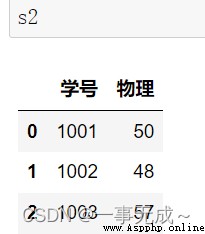
s2=pd.DataFrame(data={ '學號':[1001,1002,1003], '物理':[50,48,57] })
new_s=pd.merge(s1,s2,on='學號')
print(new_s)
左連接
s1=pd.DataFrame(data={ '學號':[1001,1002,1003], '語文':[56,38,47], '數學':[88,19,70], '英語':[96,78,81] })
s2=pd.DataFrame(data={ '學號':[1001,1002], '物理':[50,48] }) new_s=pd.merge(s1,s2,how='left',on='學號')
右連接
s1=pd.DataFrame(data={
'學號':[1001,1002],
'語文':[56,38],
'數學':[88,19],
'英語':[96,78]
})
s2=pd.DataFrame(data={
'學號':[1001,1002,1003],
'物理':[50,48,57]
})
new_s=pd.merge(s1,s2,how='right',on='學號')
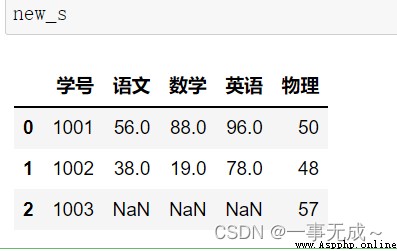
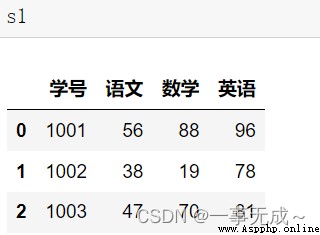
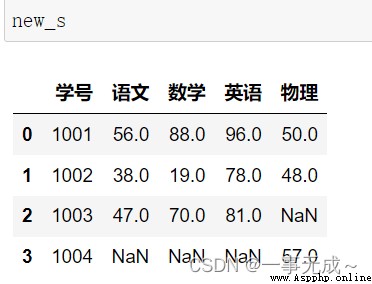
內連接 外連接
s1=pd.DataFrame(data={
'學號':[1001,1002,1003],
'語文':[56,38,47],
'數學':[88,19,70],
'英語':[96,78,81]
})
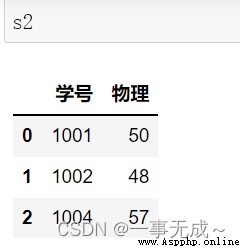
s2=pd.DataFrame(data={
'學號':[1001,1002,1004],
'物理':[50,48,57]
})
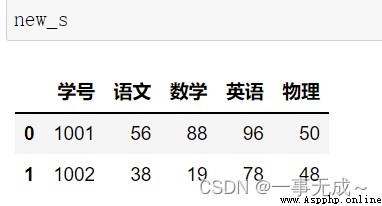
new_s=pd.merge(s1,s2,how='inner',on='學號')
外連接:new_s=pd.merge(s1,s2,how='outer',on='學號')
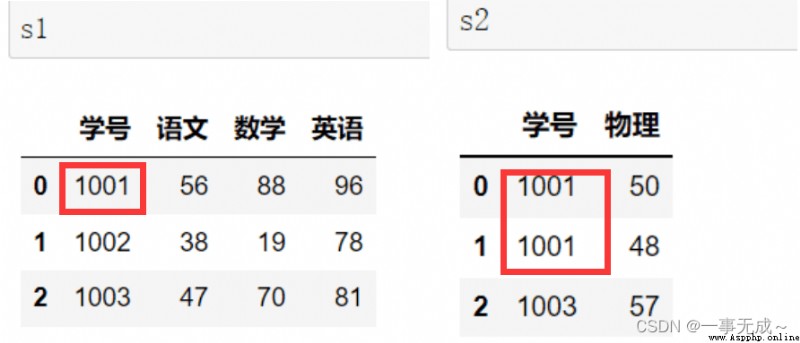
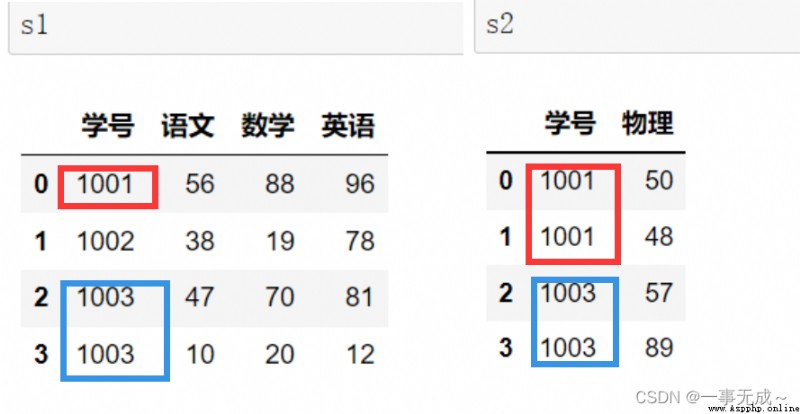
Many-to-many or many-to-one merge
語法:pd.concat(objs,axis=0,join='outer',ignore_index=False,keys=None)
參數說明:
objs:Series、DataFrame的對象等
axis:axis=1表示行, axis=0表示列,默認為0
join:值為inner(交集)或outer(聯合).默認為outer
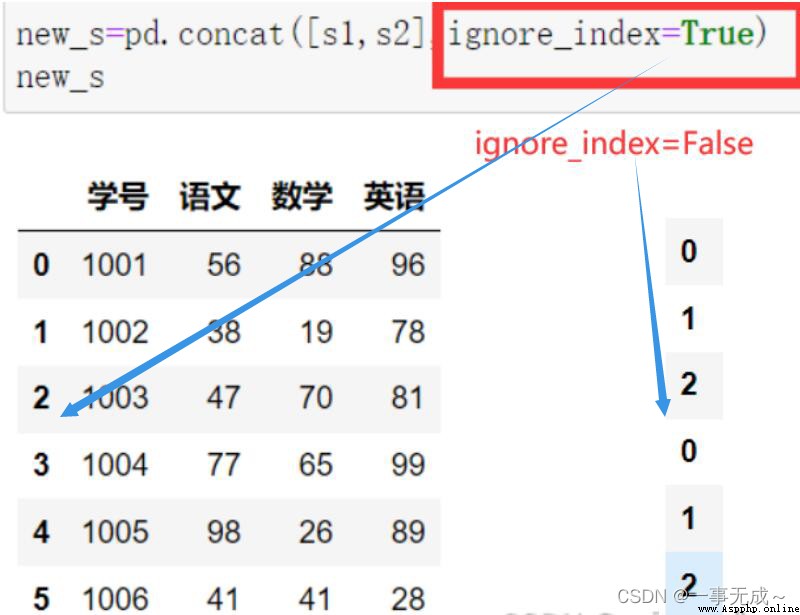
ignore_index:默認為False,Row index is preserved,If so, the row index is not preserved,則為True
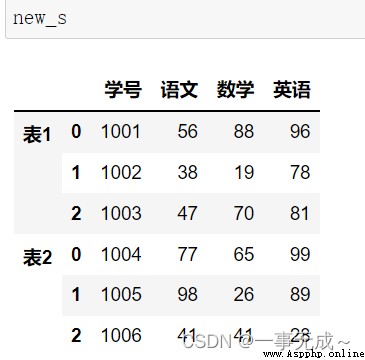
keys:使用傳遞的鍵作為最外層構建層次索引
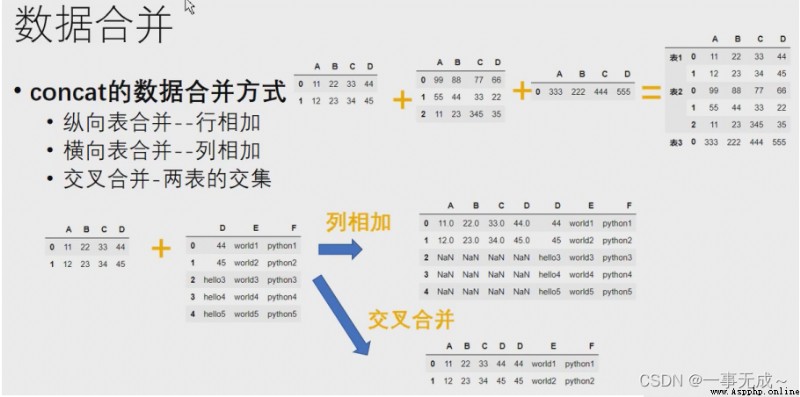
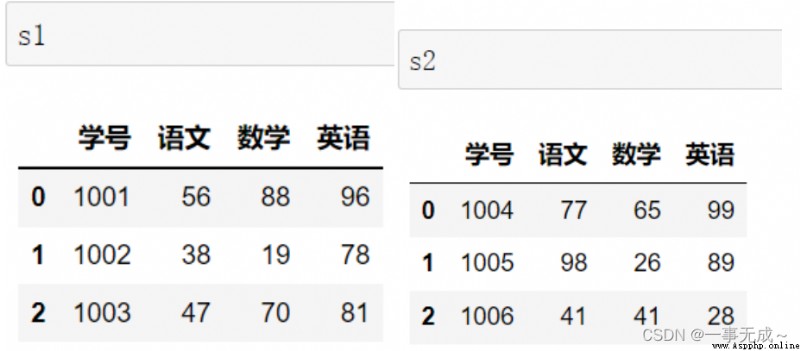
縱向合並
keys:使用傳遞的鍵作為最外層構建層次索引
ignore_index:默認為False,Row index is preserved,If so, the row index is not preserved,則為True
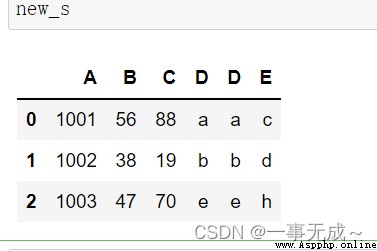
橫向合並
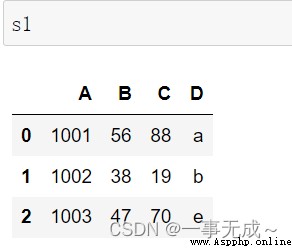
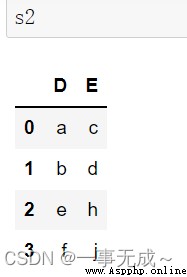
s1=pd.DataFrame(data={
'A':['1001','1002','1003'],
'B':['56','38','47'],
'C':['88','19','70'],
'D':['96','78','81']
})
s2=pd.DataFrame(data={
'D':['a','b','e','f'],
'E':['c','d','h','j']
})
new_s=pd.concat([s1,s2],axis=1)
交叉合並
s1=pd.DataFrame(data={
'A':['1001','1002','1003'],
'B':['56','38','47'],
'C':['88','19','70'],
'D':['a','b','e']
})
s2=pd.DataFrame(data={
'D':['a','b','e','f'],
'E':['c','d','h','j']
})
new_s=pd.concat([s1,s2],axis=1,join='inner')
df.to_excel()
import pandas as pd
pd.set_option('display.unicode.east_asian_width',True)
s1=pd.DataFrame(data={
'學號':[1001,1002,1003],
'語文':[56,38,47],
'數學':[88,19,70],
'英語':[96,78,81]
})
print(s1)
s1.to_excel('數據導出.xlsx',index=False)#index=False 不要索引
# s1.to_excel('數據導出.xlsx',index=False,sheet_name='demo1')#
print('----------------------------------------------導出到多個sheet表')
# 打開一個excel文件
work=pd.ExcelWriter('導出到多個sheet表.xlsx')
s1.to_excel(work,index=False,sheet_name='All grade sheets')#
s1[['學號','語文']].to_excel(work,index=False,sheet_name='語文成績表')#
# 保存
work.save()
df.to_csv(path_or_buf,sep=',',float_format=None,columns=None,header=True,index=True) 參數說明
path_or_buf:要保存的路徑及文件名 sep:分隔符,默認為逗號
float_format:浮點數的輸出格式
columns:指定要導出的列,用列名、列表表示,默認值為None. header:是否輸出列名,默認值為True
index:是否輸出索引,默認值為True
import pandas as pd
pd.set_option('display.unicode.east_asian_width',True)
s1=pd.DataFrame(data={
'學號':['1001','1002','1003'],
'語文':[56.12,38.36,47.89],
'數學':[88,19,70],
'英語':[96,78,81]
})
print(s1)
s1.to_csv('數據導出.csv',index=False,columns=['學號','語文','數學','英語'],float_format='%.1f')pd.to_datetime()
Multi-column combined date

import pandas as pd
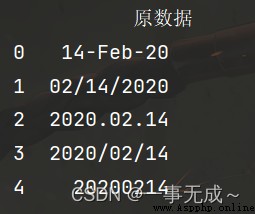
s=pd.DataFrame(data={
'原數據':['14-Feb-20','02/14/2020','2020.02.14','2020/02/14','20200214']
})
print(s)
print('--------------------------------------------日期轉換')
s1=pd.to_datetime(s['原數據'])
print(s1)
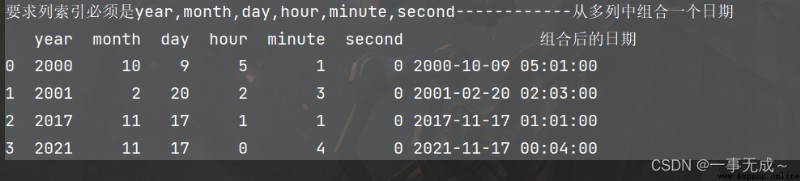
print('Required column index must beyear,month,day,hour,minute,second------------Combine a date from multiple columns')
s2=pd.DataFrame(data={
'year':[2000,2001,2017,2021],
'month':[10,2,11,11],
'day':[9,20,17,17],
'hour':[5,2,1,0],
'minute':[1,3,1,4],
'second':[0,0,0,0]
})
s2['組合後的日期']=pd.to_datetime(s2)
print(s2)
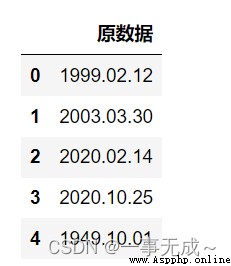
import pandas as pd
s=pd.DataFrame(data={
'原數據':['1999.02.12','2003.03.30','2020.02.14','2020.10.25','1949.10.01']
})
s
s['日期']=pd.to_datetime(s['原數據'])
s['年']=s['日期'].dt.year
s['月']=s['日期'].dt.month
s['日']=s['日期'].dt.day
s['星期']=s['日期'].dt.day_name()
s['季度']=s['日期'].dt.quarter

獲取1999年的數據
s.loc['1999']
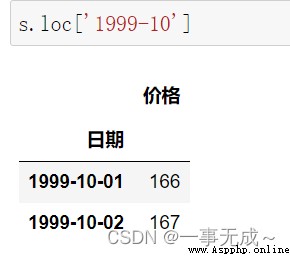
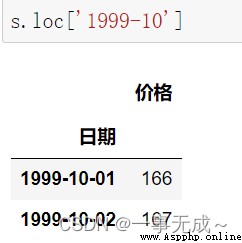
Get a month's data
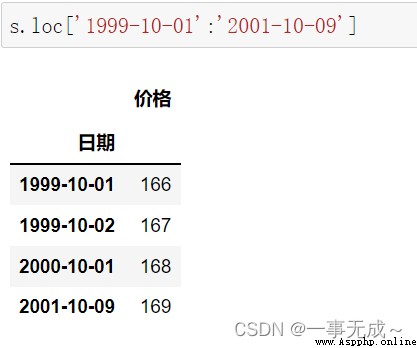
Get data for a certain period of time
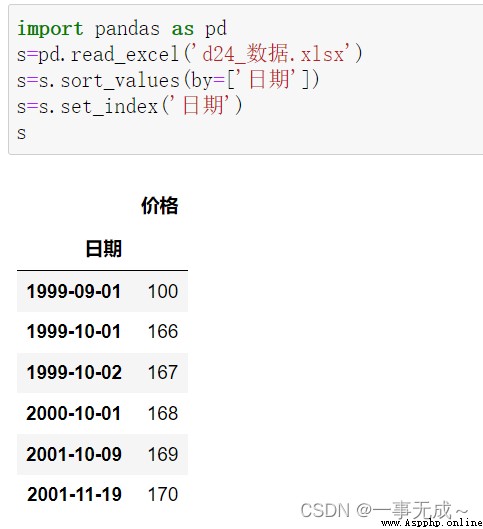
import pandas as pd
s=pd.read_excel('d24_數據.xlsx')
s=s.sort_values(by=['日期'])
s=s.set_index('日期')
print(s)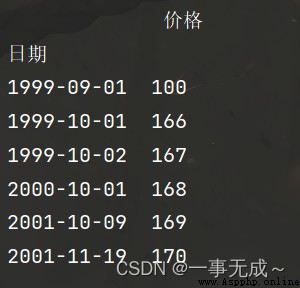
print('------------------------------------------------------------------按年-')
s1=s.resample('AS').sum()
print(s1)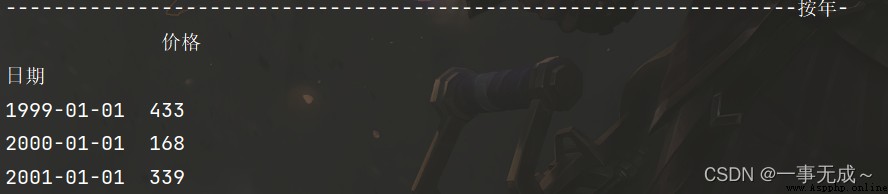
print('------------------------------------------------------------------按季度-')
s1=s.resample('Q').sum()
print(s1)
print('------------------------------------------------------------------按月-')
s1=s.resample('M').sum()
print(s1)
print('------------------------------------------------------------------按星期-')
s1=s.resample('W').sum()
print(s1)
print('------------------------------------------------------------------按天-')
s1=s.resample('D').sum()
print(s1)import pandas as pd
s=pd.read_excel('d24_數據.xlsx')
s=s.sort_values(by=['日期'])
s=s.set_index('日期')
print(s)
print('------------------------------------------------------------------按年-')
s1=s.to_period('A')
print(s1)
print('------------------------------------------------------------------按季度-')
s1=s.to_period('Q')
print(s1)
print('------------------------------------------------------------------按月-')
s1=s.to_period('M')
print(s1)
print('------------------------------------------------------------------按星期-')
s1=s.to_period('W')
print(s1)
print('------------------------------------------------------------------按天-')
s1=s.to_period('D')
print(s1)
import pandas as pd
s=pd.read_excel('d24_數據.xlsx')
s=s.sort_values(by=['日期'])
s=s.set_index('日期')
print(s)
價格
日期
1999-09-01 100
1999-10-01 166
1999-10-02 167
2000-10-01 168
2001-10-09 169
2001-11-19 170
print('------------------------------------------------------------------按年-')
s1=s.resample('AS').sum().to_period('A')
print(s1)
print('------------------------------------------------------------------按季度-')
s1=s.resample('Q').sum().to_period('Q')
print(s1)
print('------------------------------------------------------------------按月-')
s1=s.resample('M').sum().to_period('M')
print(s1)
print('------------------------------------------------------------------按星期-')
s1=s.resample('W').sum().to_period('W')
print(s1)
print('------------------------------------------------------------------按天-')
s1=s.resample('D').sum().to_period('D')
print(s1)
pandas.date_range()函數 Generate a time index with a fixed frequency
語法
pd.date_range(start=None,end=None,periods=None,freq='D')
參數說明
必須指定start、end、periods中的兩個參數值 periods:固定時期,取值為整數或None
freq:日期偏移量,取值為string或DateOffset,默認為'D',取值可為
D:日歷日頻率
W:每周頻率 M:月末頻率 H:每小時頻率 T:分鐘的頻率 S:秒鐘的頻率
import pandas as pd
s=pd.date_range(start='2022-01-01',periods=10,freq='W')
k=pd.DataFrame(s)
print(k)
# 0
# 0 2022-01-02
# 1 2022-01-09
# 2 2022-01-16
# 3 2022-01-23
# 4 2022-01-30
# 5 2022-02-06
# 6 2022-02-13
# 7 2022-02-20
# 8 2022-02-27
# 9 2022-03-06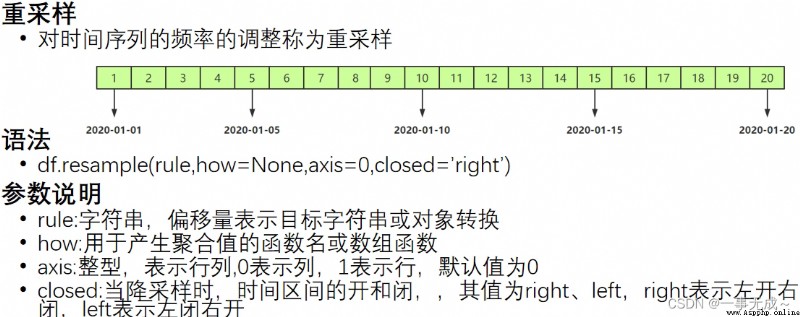
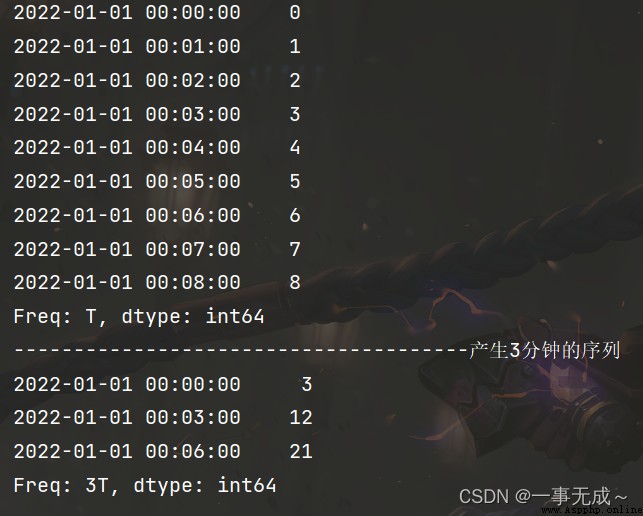
import pandas as pd
s=pd.date_range(start='2022-1-1',periods=9,freq='T')
a=pd.Series(data=range(9),index=s)
print(a)
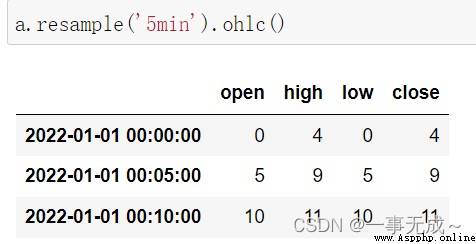
print('--------------------------------------產生3sequence of minutes')
a=a.resample(rule='3T').sum()
print(a)
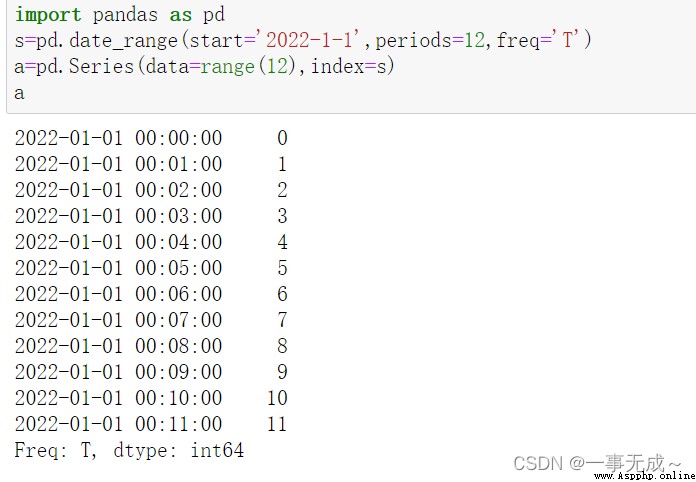
import pandas as pd
s=pd.date_range(start='2022-1-1',periods=12,freq='T')
a=pd.Series(data=range(12),index=s)
aa.resample('5min').ohlc()
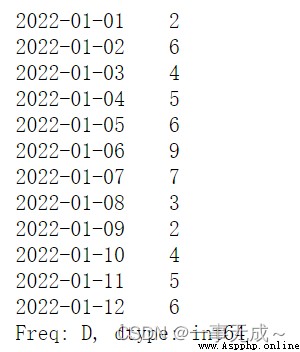
df.rolling(windows,min_periods=None,axis=0)
import pandas as pd
s=pd.date_range(start='2022-1-1',periods=12,freq='D')
a=pd.Series(data=[2,6,4,5,6,9,7,3,2,4,5,6],index=s)
a
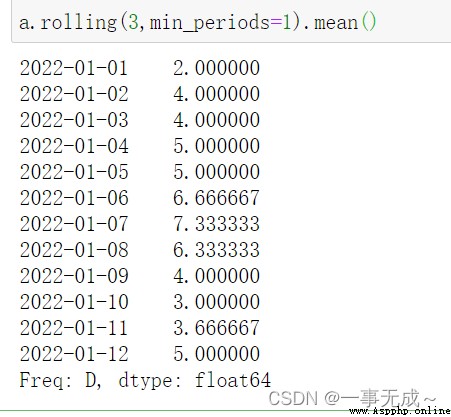
print('---------------------------------------計算3天的均值')
a.rolling(3,min_periods=1).mean()