吳恩達機器學習的課程作業裡,經常會出現以mat數據存儲的圖像,為此我十分好奇,中間過程是怎麼實現的,這篇博客簡單的學習一下:
首先,我們看一下圖片:(圖片來源於網絡,如有侵權,請立刻聯系我刪除)

導入需要用到的包
import PIL.Image as Image
import numpy as np
import pandas as pd
import os
import matplotlib.pyplot as plt
from scipy.io import loadmat
file_name = "113936HmJVY.jpg"
將圖片轉換為矩陣
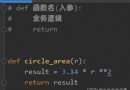
def image_to_matrix(file_name):
# 讀取圖片
image = Image.open(file_name)
# 顯示圖片
image.show()
width, height = image.size
# 灰度化
image_grey = image.convert("L")
data = image_grey.getdata()
data = np.matrix(data, dtype="float") / 255.0
new_data = np.reshape(data, (height, width))
return new_data
我們生成的數據矩陣為:
[[0.05098039 0.07058824 0.08235294 ... 0.11372549 0.10588235 0.11372549]
[0.05490196 0.07058824 0.09019608 ... 0.10588235 0.10588235 0.10980392]
[0.07058824 0.0745098 0.09411765 ... 0.10980392 0.10980392 0.10980392]
...
[0.07843137 0.09019608 0.08627451 ... 0.23529412 0.23921569 0.23137255]
[0.0627451 0.07058824 0.07058824 ... 0.23921569 0.23529412 0.22352941]
[0.07843137 0.0745098 0.0745098 ... 0.24705882 0.23921569 0.22745098]]
我們轉換成dataframe的格式,方便查看:
dataframe = pd.DataFrame(data=data)
print(dataframe)
 0 1 2 ... 1917 1918 1919
0 0.050980 0.070588 0.082353 ... 0.113725 0.105882 0.113725
1 0.054902 0.070588 0.090196 ... 0.105882 0.105882 0.109804
2 0.070588 0.074510 0.094118 ... 0.109804 0.109804 0.109804
3 0.066667 0.090196 0.125490 ... 0.109804 0.101961 0.105882
4 0.070588 0.109804 0.137255 ... 0.109804 0.101961 0.109804
... ... ... ... ... ... ... ...
1075 0.074510 0.062745 0.070588 ... 0.227451 0.227451 0.227451
1076 0.094118 0.094118 0.094118 ... 0.231373 0.239216 0.231373
1077 0.078431 0.090196 0.086275 ... 0.235294 0.239216 0.231373
1078 0.062745 0.070588 0.070588 ... 0.239216 0.235294 0.223529
1079 0.078431 0.074510 0.074510 ... 0.247059 0.239216 0.227451
可以看出,我們的圖像大小為:1920*1080
將矩陣轉換為圖片
def matrix_to_image(data):
data = data * 255.0
new_im = Image.fromarray(data)
return new_im
new_im = matrix_to_image(data)
plt.imshow(data, cmap=plt.cm.gray, interpolation="nearest")
new_im.show()

可以實現!
上面要先對圖片去除顏色,就是變成黑白的,轉換成二維數據矩陣,不去顏色的還要保存顏色的,然後後面轉換就不行了。然後利用Image.fromarray(data) 新建圖片
import PIL.Image as Image
import numpy as np
import pandas as pd
import os
import matplotlib.pyplot as plt
from scipy.io import loadmat
# 將圖片轉換為矩陣
def image_to_matrix(file_name):
# 讀取圖片
image = Image.open(file_name)
# 顯示圖片
image.show()
width, height = image.size
# 灰度化
image_grey = image.convert("L")
data = image_grey.getdata()
data = np.matrix(data, dtype="float") / 255.0
new_data = np.reshape(data, (height, width))
return new_data
# 將矩陣轉換為圖片
def matrix_to_image(data):
data = data * 255.0
new_im = Image.fromarray(data)
return new_im
# 定義圖片路徑
file_name = "113936HmJVY.jpg"
# 將圖片轉換為矩陣並輸出到csv文件
data = image_to_matrix(file_name)
print(data)
print('=='*30)
dataframe = pd.DataFrame(data=data)
print(dataframe)
# dataframe.to_csv('d:/out.csv', sep=' ', header=False, float_format='%.2f', index=False)
# 將矩陣轉換為圖片
new_im = matrix_to_image(data)
plt.imshow(data, cmap=plt.cm.gray, interpolation="nearest")
new_im.show()
 Send you a complete set of exclusive Python code for Valentines Day (robbery)
Today is Valentines Day , Give
 Python conjugation editing and modification system based on wechat development Rar (python+uniapp+diango) thesis + project source code
、 introduction 1 2、 Technical